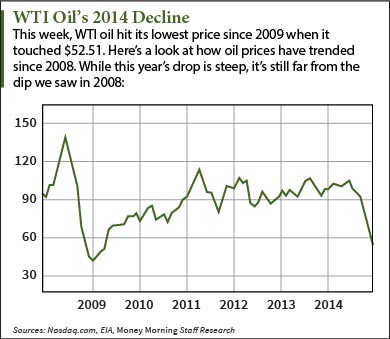
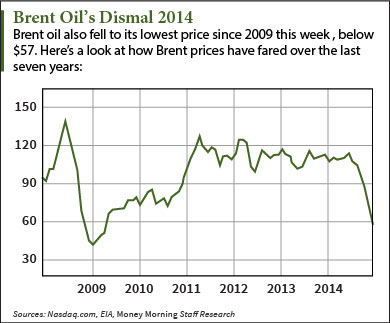
Oil hit its lowest point in more than five years this week, continuing 2014's huge drop. This WTI crude oil price chart and Brent oil chart show how large the oil crash of 2014 has been.
In June, WTI oil futures traded as high as $101.33 per barrel. This week they touched $52.51.
 That's a drop of 48.2% in just six months.
Brent oil futures have followed the same pattern. In June, Brent traded near $111 per barrel. Just six months later, Brent was down 48.6%, below $57 per barrel.
Editor's Note: This past year was the biggest the IPO market has seen since the dot-com era of 2000. 2015 will bring more of the same -- and one of these companies could be the most promising new stock for investors...
 And while both of these declines have been steep, they pale in comparison to the drop from 2008.
From July 2008 through December 2008, WTI oil crashed more than 71%. At its 2008 peak, WTI traded for more than $140 per barrel. By the end of December, WTI was priced near $40.
As these oil price charts indicate, a very similar crash occurred for Brent oil in 2008 as well.
The crashes of 2008 and 2014 are the two biggest one-year drops in oil prices since futures contracts began trading in the 1980s.
While 2014 will be a losing year for oil, next year is already shaping up to be better.
In fact, we just outlined the reasons to be bullish on oil in our 2015 Oil Price Forecast.
You see, while the price of oil has dropped precipitously since June, prices won't remain at these muted levels for long.
"Crude has the ability to quickly self-correct, which is why long-time oil veterans aren't worried about falling prices," Money Morning's Global Energy Strategist Dr. Kent Moors said.
Here's what oil investors can expect in 2015 and the best way to profit from the energy sector...


