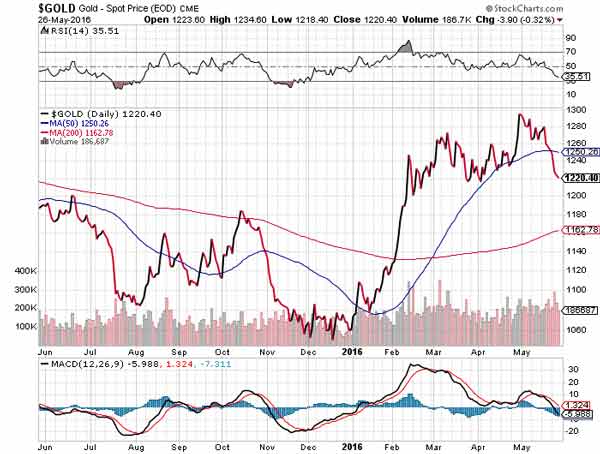
Over the past several weeks, I've been warning readers about the likelihood we'd face a correction in gold prices.
Gold prices peaked near $1,300 in late April and had been trending sideways with a downward bias since then.
But the release of the April Federal Open Market Committee minutes last week tipped the scales decidedly against gold prices.
 Last week, I told readers about the most crucial gold price levels of 2016. As it turns out, we've hit both of those levels, and that could be setting us up for another move lower for the price of gold in 2016.
That's why I'm bringing readers a new gold price target.
But before we get to that target, here's how the price of gold is trending this week...
Why Gold Prices Dropped This Week
Gold prices closed last week on a high note, but that momentum wouldn't last.
The price of gold ended last week at $1,252 per ounce. On Monday, gold began trading at $1,249 and closed down slightly at $1,248.
But Tuesday is when the pressure arrived. Not coincidentally, that's when the U.S. Dollar Index (DXY) surged to about 95.65 intraday, its highest level in almost two months. Gold prices opened at $1,240 at 8:00 a.m. and then fell pretty consistently throughout the day to close at $1,227.
The price of gold continued even lower through Wednesday and closed down to $1,224.
Gold opened Thursday a little higher at $1,228 but was unable to hold that level. The DXY dropped below 95 for a short time, but that could not prop up gold prices, which closed down at $1,219.
Now that we've looked at what has sent gold prices lower this week, here's what's next for the gold price in the short term. Plus, here's my new projection for where gold prices in 2016 could be headed...
Where Gold Prices Are Headed Now in 2016
[mmpazkzone name="in-story" network="9794" site="307044" id="137008" type="4"]
A correction in a stock, bond, or commodity is widely accepted to be a drop of at least 10% in its price. In the case of gold, which peaked at $1,296.50 one month ago, a 10% drop would take it to $1,167.
If we look at a chart of the gold price, we can see that there's considerable support at $1,200, below that at $1,180, and then at $1,160, which coincides with the 200-day moving average at $1,163.
Meanwhile, both the relative strength index (RSI) and moving average convergence divergence (MACD) are trending downwards, indicating negative momentum currently and likely ahead.
Consider too that the next couple of months are a seasonally weak time for gold prices. That typically ends in July. So we could see the current weakness persist for a while yet.
We'll have to watch for the gold price to bottom out, perhaps at one of the levels I suggested above. Those levels are between $1,180 and $1,160. We'll also need to see momentum turn up to help kick-start that move.
And finally, if the U.S. Dollar Index decides to top out, we could have the three inputs that would help cement the beginning of a new move higher for gold.
The Bottom Line: Gold prices have lost some of their momentum from early 2016. We could see prices continue lower in the short term, perhaps to the $1,180 to $1,160 range. But long-term catalysts for gold prices still remain in 2016.
Follow Money Morning on Facebook and Twitter.
Bank Profits on Gold Prices No Matter Where They Move: Metals like gold and silver are must-have investments for your portfolio. That's because they serve as "crisis insurance" from volatility in the broader market. But most investors don't know how to trade gold or get their hands on it. Here's your essential guide to investing in gold and silver this year...


