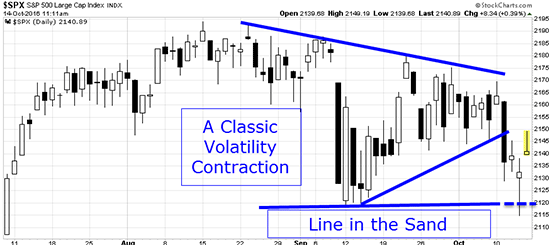
Earlier this week, we saw the markets in a compression pattern, a triangle. That's when I made this prediction:
"A break and close below the 2,140 zone will bring our 'Line in the Sand' back into play."
My prediction came true - that's exactly what happened.
That's what makes technical analysis of charts like this so powerful...
We're Out of the Triangle, Back on the "Line"

This most recent market activity breaks us out of a short-term triangle pattern and transitions us into a slightly longer-term pattern that features our "Line in the Sand" more prominently.
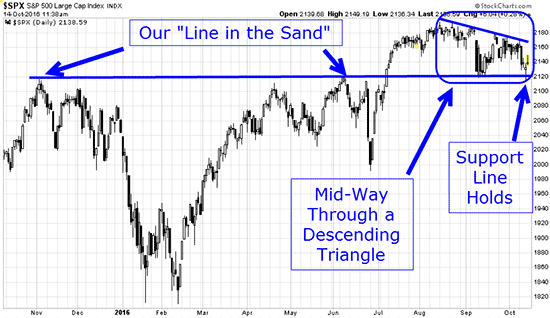
On this chart below, our "Line in the Sand" is a price zone that was a resistance level - a "ceiling" for stocks - from November 2015 through July 2016. Price then broke through decisively in July and since then, this same price zone has proved to be a key support level - a "floor" for stock prices.

Late last week, on Oct. 13, we were socked with very disappointing monthly export data out of China. Rather than going up - a symptom of the "bad news is good news" syndrome gripping the markets - traders in fact reacted negatively to this report because it is an indication of declining global economic health.
That drove prices down in trading, but by the end of the day Thursday, our "Line in the Sand" had held and price was rebounding.
Incidentally, this "Line in the Sand" put our Stealth Profits Trader Micron Tech options play within inches of its first profit target. It really is that powerful.
This Line Is Going to Be Even More Important Going Forward
The last item to note on the chart above is the descending triangle that is forming on the right side of the chart. It has our "Line in the Sand" as its flat lower boundary and a descending trend line that forms the top of the triangle.
[mmpazkzone name="in-story" network="9794" site="307044" id="137008" type="4"]
Descending triangles are classically bearish patterns, making our "Line in the Sand" an even more significant level to monitor.
A break of that key zone (Line in the Sand) will bring the Brexit lows from the end of June into play.
On the flip side, a close or two above the down sloping trend line will set the market up for more upside. And be aware that broken bearish patterns make the potential for an extended bull move much more probable.
Follow us on Twitter @moneymorning and like us on Facebook.
About the Author
D.R. Barton, Jr., Technical Trading Specialist for Money Map Press, is a world-renowned authority on technical trading with 25 years of experience. He spent the first part of his career as a chemical engineer with DuPont. During this time, he researched and developed the trading secrets that led to his first successful research service. Thanks to the wealth he was able to create for himself and his followers, D.R. retired early to pursue his passion for investing and showing fellow investors how to build toward financial freedom.


