 In 2011, the U.S. real estate market finally started to look as though it was on the path to recovery from the 2008 housing bubble crisis.
The percentage of families behind on mortgage payments fell from 2.2% to 1.9% that year. Home prices were 90% of the way back to aligning with their owners' household incomes; in other words, homeowners were no longer living beyond their means.
Five years later in 2016, the national housing market appears to be thriving. According to a U.S. Census Bureau report released on Sept. 28, more new homes were sold in July of this year than in nearly a decade. On top of that, buyers purchased single-family houses at the annual rate of 654,000 -- the highest rate since October 2007.
However, some areas in the United States recovered from the crisis too fast. Their housing markets ballooned to overvalued levels.
Don't Miss: How to Make a Killing... When Everyone Else Is Panicking
But before we get into the six cities on the verge of a housing bubble, here's what you need to know about how we identify bubble indicators...
How to Calculate a Potential Housing Bubble
The value of a housing market in a certain area is determined by how much the homes there have either appreciated or depreciated in value, coupled with the rise or decline of those homes' actual prices, over a predetermined amount of time. In other words, you look at these two factors:
- For most major metropolitan areas in the United States, healthy market appreciation/depreciation is between a -0.5% decrease and a 0.5% increase in value annually. When an area falls under -0.5% or above 0.5% -- placing it outside the healthy range -- there is bubble potential.
- As far as housing prices are concerned, most U.S. cities have seen real estate costs (housing prices) rise about 15% annually on average since 2011. When an area's housing prices exceed the annual 15% increase, there is bubble potential.
Boston, Mass., is a good example of a healthy, non-bubble real estate market. Boston's overall housing market has appreciated 0.25%, which is within fair-value bounds (i.e., it falls within the -0.5% to 0.5% range). Additionally, housing prices have remained around an annual 15% appreciation rate for the past five years.
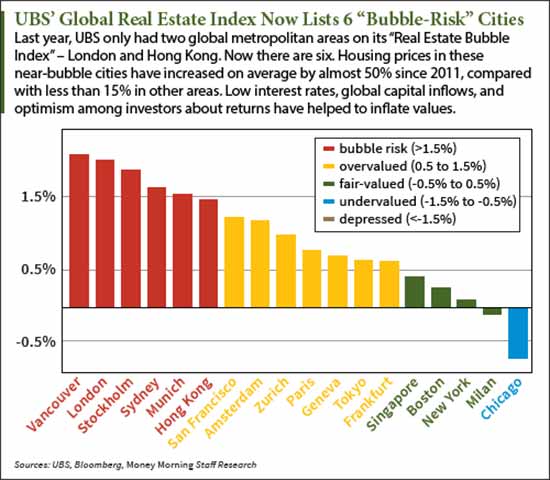
Some cities, however, have experienced an unhealthy level of value depreciation during that same span of time - such as New York and Chicago. They both fell below the -0.5% healthy depreciation benchmark, having been largely outpaced by the overall U.S. real estate market:

Then there are a few cities -- the ones that recovered from the recession too fast -- that are starting to look bubbly all over again. They meet both criteria: Their housing markets are considered overvalued (above 0.5%), and their housing prices have skyrocketed well above 15% within the last five years...
These cities are:
- San Jose
- San Francisco
- Austin
- Salt Lake City
- Dallas
- Los Angeles
In fact, San Jose and San Francisco's housing prices have both seen a 50% increase since 2011.
Must Read: How to Make a (Stress-Free) Killing with Options
This happened for several reasons:
- Economic prosperity in the area put more money in consumers' pockets, allowing them to make such large purchases
- Low inventory of good homes drove up pricing
- Speculative investor behavior (risky behavior with purchases they might not be able to afford in the long term)
But all hope is not lost for the real estate market in these six U.S. cities. Even though they're on the verge of a housing bubble, their current rates of expansion aren't that bad when you zoom out and look at the cumulative history of housing bubbles...
[mmpazkzone name="in-story" network="9794" site="307044" id="137008" type="4"]
Housing Bubble Stats Now Are Not as Bad as a Decade Ago
Jon Woloshin, a strategist at UBS Wealth Management Americas, told Bloomberg on July 18 that there's no need for the kind of concern about a national housing crash that was seen in the United States a decade ago.
For one, the value of these "bubble risk" cities isn't being driven by faulty mortgage products that people can't afford, which lead to the 2008 subprime mortgage crisis.
Woloshin compiled his own index based on six factors (instead of just two - housing prices and overall market appreciation/depreciation) he deemed crucial to the housing boom and bust of the mid-2000s. Those factors were:
- Price appreciation
- The prevalence of house-flipping
- Share of buyers who used mortgage financing
- Price-to-income percentage
- Price-to-rent percentage
- Housing starts-to-household formation
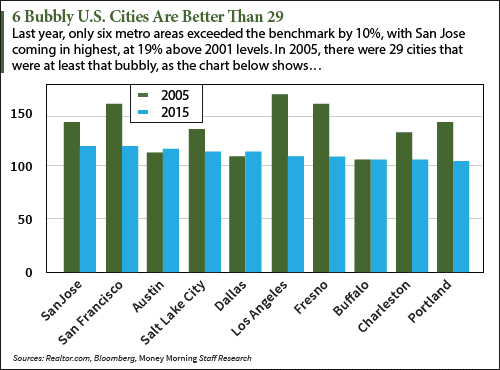
Wolshin benchmarked his index's appreciation value based on the real estate market of 2001 - a year that best represents when the U.S. housing market was at its most balanced. Then he compared these cities currently at "bubble risk" to how over-appreciated they were right before the housing bubble burst a decade ago.
Here's what he found:

Up Next
Money Morning's News Team recently interviewed Joe Manousa, whose 26 years of Tallahassee real estate experience helps him identify both macro and micro real estate trends in order for his clients to profit.
He's been studying the current home-buying market -- and he's found a profit play within what he calls a "compression market."
Here's Manousa's advice on how to capitalize in the real estate industry right now...
Follow Money Morning on Twitter @moneymorning and on Facebook.
Related Articles:
- Bloomberg: It's Not a Housing Bubble, It's Just Expensive
- Money Morning: These 7 "Debt Bomb" Companies Are Set to Explode When Rates Rise
- Money Morning: Don't Be Fooled, Negative Interest Rates Are a Massive Failure
- Money Morning: These Markets Are the Definition of Insanity - Here's Why... and What to Do Now


