Back in May 2008, when global investors still expected economic growth to continue, a thinly followed index began to broadcast a "red-alert" warning to those few who were watching.
The index proceeded to drop by more than 90% in the next six months.
Had you been watching - and heeded its warning - this index would have saved you from the fallout of the biggest financial crisis since the Great Depression.
And here's the thing. This index is updated five days a week and is readily available to anyone who wants to track it.
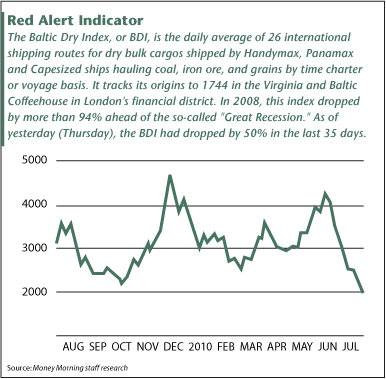
The index in question is called the "Baltic Dry Index," or BDI, and it once again merits a closer look: After peaking in May, the BDI has fallen for 35 straight days.
Is this another economic red alert, or merely a statistical red herring, like so many of the other economic reports that have appeared during the often-contradictory, whipsaw markets we've seen of late?
Let's take a closer look...
A Look Back at the Last Warning
The Baltic Dry Index is a number issued daily by the London-based Baltic Exchange. Not restricted to Baltic Sea countries, the index tracks worldwide international shipping prices of various dry bulk cargoes.
The index provides investors and others with an idea of how much it will cost to move major raw materials by sea (in bulk, hence the name). Taking in 26 shipping routes measured on a time-charter and voyage basis, the BDI covers Handymax, Panamax, and Capesize dry bulk carriers shipping a plethora of commodities - including coal, iron ore, and grain.
If we look back at the BDI plunge that presaged the "Great Recession," we can see that outside events coincided with the index decline.
Crude oil peaked at an all-time high in a speculative frenzy in July 2008, and then reversed course. In September and October we witnessed the "big unwind," as Lehman Bros. Holdings Inc. (OTC: LEHMQ) collapsed, American International Group Inc. (NYSE: AIG) was torpedoed by its credit-default-swap (CDS) business, and mortgage giants Fannie Mae (NYSE: FNM) and Freddie Mac (NYSE: FNM) imploded.
The index kept dropping as shipping companies parked their fleets. It let anyone who was following it know - in advance - that things were continuing to get worse.
When the index finally bottomed in December 2008, it established a bottom so low that it represented the ability to rent a 1,000-foot ore-class ship for less than the cost of the fuel it would burn if left to idle for a day. Ships that chartered for $48,000 back in May can now be had for $18,000 a day, a Lombard Street Research analyst told The Economist.
To the investors who watched this index, all of this was pretty obvious. Unfortunately, not many investors were watching.
And now the BDI is flashing "Red Alert" once again.
The Return-Trip Ticket
As important as it is to understand that a crash is imminent, I believe it's just as crucial to be ahead of the game by understanding when a rebound is at hand.
The Baltic Dry Index performs that early warning system function just as well. It had fully bottomed three months before U.S. stocks ended their sell-off. By January 2009, in fact, the BDI had signaled to "informed investors" that it was time to start nibbling again.
As a fund manager working to navigate the crash, I made sure that my shop relied on this index: Along with some other tools, the BDI provided us with insights about how the U.S. and global economies were behaving. It provided us with a panoramic view of what global manufacturers were doing with their raw ore reserves.
That brings us back to the present.
Back on the Tarmac
The BDI most recently topped out in May. As of yesterday (Thursday), it has already dropped 35 days in a row.
That's significant.
This string of "down days" is the longest in at least nine years, The Economist reported this week. During the crash of 2008, the index never fell 35 days in a row.
Today, the BDI is again flashing serious warning signs that not everything is as it appears. It may be warning us about the start of a "double-dip" recession, or it may be telling us that something even worse is at hand.
Historically, the Baltic Dry Index has shown itself to be the EKG of future industrial demand. And, right now, the BDI is screaming "Danger, Will Robinson!" to any investor who will read it and heed it as a true leading indicator.
If the price of refined copper is called "Dr. Copper," for its ability to ascertain the health of the demand for growth in an economy, the BDI is the daily heartbeat for near-term future industrial demand.
Combined, those two indicators can provide investors with a view of whether the world economy is growing or shrinking, based on the big picture of world demand for growth. Currently, the BDI is flashing serious warning signs to anyone who is looking at it.
The drop in the BDI index in 2008 was one of the most obvious signs of the real impact that the so-called "Great Recession" would have. From May 20, 2008 to Dec. 3, 2008, the BDI fell from its high of 11,793 to its low of 663 - a near-freefall of 94%.
Moves to Consider Now
Given the signals we're getting from the Baltic Dry Index, the question to ask is clear: Are you preparing your portfolio so it includes protection against a possible additional leg down in the market?
It may help to understand the specific moves you'd want to consider.
Remember, back in 2008 the BDI had dropped for nearly two months before crude oil hit that July record peak and then started to unwind.
We will want to keep an eye on other raw commodity prices for similar "topping" actions, as we watch for confirmation of weakness in our favorite natural resources.
When demand is dropping for raw bulk materials, and the inventory of refined products like copper is growing, we will know it is time to consider putting in a "short" play on some of our commodity futures via long-dated put options.
Action to Take: The odds of a double-dip recession escalate even as volume dries up during summer trading. Put tight stops on any speculative position that you would be uncomfortable holding through a "2008-like" financial event that could strike this fall. You want to have enough liquidity to be able to buy when the next "March-2009-like" market bottom occurs. It won't play out just like the last one, but there will be similarities. You will need the financial firepower - cash - to take advantage of such a great possible entry point. Be prepared.
[Editor's Note: Jack Barnes started his career at Franklin Templeton in 1997, working with the company's portfolio team in its fund-information department - just as the Asian contagion infected the Asian tiger countries. He launched his own RIA shop in 2003 just as the second Gulf War was breaking out. In early 2006, after logging a one-year return of nearly 83%, Forbes named Barnes the top stock picker in its "Armchair Investors Who Beat the Pros" competition. His two audited hedge funds generated double-digit returns in 2008. Last summer, Barnes retired to the beach - which is where he writes from now.]
News and Related Story Links:
- Money Morning Investigative Series:
Foreign Bondholders - and not the U.S. Mortgage Market - Drove the Fannie/Freddie Bailout. - The Baltic Exchange:
Official Website. - Wikipedia:
Baltic Dry Index. - The Free Dictionary:
Copper. - Wikipedia:
EKG. - Real Clear Markets:
The Great Recession's Stranglehold Continues. - Wikipedia:
Danger, Will Robinson! - Investopedia:
Put Option. - Forbes:
Eight Armchair Investors Who Beat the Pros. - The Economist:
Baltic Dries Up. - Lombard Street Research:
Official Website.
Here Are 10 “One-Click” Ways to Earn 10% or Better on Your Money Every Quarter
Appreciation is great, but it’s possible to get even more out of the shares you own. A lot more: you can easily beat inflation and collect regular income to spare. There are no complicated trades to put on, no high-level options clearances necessary. In fact, you can do this with a couple of mouse clicks – passive income redefined. Click here for the report…
Don't forget that shipping day rates are also based upon total amount of tonnage afloat. North Korean and Chinese shipyards are churning out vessels. In China, vessel building contracts that have been cancelled by the customer have been continued – the Chinese government/national banks become the new customer. This excess shipping capacity will depress prices for some time to come, even with an increase in raw material shipping.
Please change "North Korean to South Korean".
I am somewhat astonished that I have not heretofore had the BDI in my gunsights. Thanks for the heads up! JMT
Read the article with interest. How does one find the Index?
Must you have to join the Baltic Exchange to gain access to the Index?
Well said Jack Barnes. Someone who speaks the truth in the markets about our reality.
Compared to cheerleaders like Jon Markman and our teleprompter speech reader in DC.
Interesante
The index spiked upward in 2007 – the crash was really a warning but also merely a symptom …however…business is supply and demand and perhaps too many newbuildings are entering into the equation to sustain the recent highs of the BDI in November 09 – currently rail and container rates are racing upward.
Thank you Mr. Barnes….the BDI appears to be worth looking into!
Makes pretty simple and profound sense. Carrier volume is a pretty good indicator of economic action. Might make the allegory of blood pressure though instead of EKG. No matter how low the BDI goes the patient will never die like with a heart attack. The patient will become really ill but will recover sooner or later.
Here we go again! Temporary stupid moves by our government to add stimulus for stupid shovel ready projects that do nothing to resolved our trade imbalance just delayed the big recession/depression and will make it deeper. When are these bozos in washington going to understand that the trade imbalance and jobs in the us is the road to recovery. Globalization and free trade helps large US companies improve their business and profits. It does not help US citizens. Companies are today Global enttities and not national entities. Large American companies made Americans and themselves wealthy when they were Nastional Entities, now they are making themselves wealthy only. Today GM sells more cars in China than they do in the USA. Today the US imports more than 80% of their non oil imports from China. Today, the US imports almost a billion dollars a day in oil. Today, US imports excced exports by nearly 2 billion dollars a day. Today, there are only 166,000 Americans in the USA working in manufacturing. We as a people and culture are on our way out. Our government needs to open their damn eyes and get off their pedastal….the USA is no longer a leader in economic power. We are a leader in debt and consumption. This is not a good place to be and our children will suffer. The real question is are we going to have a revolution after we are living in tents….or are we going to open our eyes and do the smart things we need to do to survivie and salvage our culture.
Is there a place (free) where I can go to see the Baltic Index on a regular basis? It sounds like a very good index to watch. Thanks, Tom A.
How does one track the BDI without being a member of Baltic Exchange?
If Bloomberg has it, it is well hidden.
I heard at my broker's luncheon on Wed. that container sales are up, and that BDI is down not due to reduced shipments, but because at least 17 new ships were launched.
Comments?
Are there any other quote/chart/comment sources for the BDI? I can't seem to find much.
Thanks for the heads up, Jack!
I agree 100% with the article. But we should even consider that China bought big quantities of iron ore and coal in the last 12 month, so China is no more, at the moment, a big actor on the market; and too many new ships have been delivered in the past months, unfortunately exactly when China was no more a big mover of the market. So we have to take a careful position, perhaps is only a temporary retreat, or perhaps it signals something much more serious. The crazy position of European Commission and BCE (under german pressures) does not help the situation to improve, as the measures decided in Europe by the single Countries, under german pressures, are clearly deflationary, and can bring the economic situation to a new recession or even a depression. In these days you have to improve the expenditure capabilities of consumers, and only when the economy is again on track you can look after state deficits and debts, but when the economy improves is much more easy to control these two important elements without harming the economic growth. The BDI reflects all these uncertainties and sends us an alarm signal that should be seized not only by investors, but particularly by the governments all over the world.
The BDI might be close to a bottom. I see that the BDI moved up to 1720 yesterday with the Capesize and Panamax indexes bouncing higher. The Suprama and Handysize components are slightly down. It is important to note that the Harpex index, which tracks freight container shipments is still moving higher. As soon as China starts importing iron ore and coal again, the BDI should start moving up.
Charlie
Hello Jack,
another commodity to keep your eyes on, for "topping" actions, similar to that of oil in 2008, will this time be the metal SILVER.
According to silver analyst Ted Butler, the Nestor of the silver industry, silver is on the verge of breaking out to the up-side, in a move, the suddenness and magnitude will never have been seen before in financial history.
I have never heard Mr. Butler, who has followed and analysed the silver industry for some 30+ years now, speak in this way before, about the imminence of such a break-out in the price of silver, to the up-side.
After having examined his presented reasons, for this violent move up in silver, and his analyses of the present supply and demand situation in silver, combined with the ongoing investigation on the COMEX, for a multi-year silver price suppression scheme, I have to say that I concur with, and tip my hat for, him.
My best advice is to forward his advice, which is to go out and buy silver in all forms, as an investment, but preferrably physical silver or reliable funds, investing in physical silver.
Your grandchildren will be happy you did.
Best Regards and Wishes for Good Investing
Joachim Troilius
Sweden
All leading indicators work until they don't. This leading indicator has been working. However there is some flawed thinking here. The demand and supply of an item can determine its price, however the demand and supply of transporting that item determines the price of moving it. The mistake here is to assume that the price that is used to move items around is determined by the items being moved, rather than the price of the number of price demanded by the movers of the items.
If there were 100 boats to move items around, then the price would be set by the demand for moving items that would fit into those 100 boats. If however another 400 boats were introduced, the price for moving those items would be drastically reduced, while the demand and supply for the items on the boats remain the same.
The demand and supply of boats determine price, not just the demand and supply of the items on the boat.
Why is this simple piece of logic not taken into account in this story?
Basically the argument here is about whether the falling prices are a product of reduced demand for shipping (bad economic news going forward) or of too many new ships being put in operation (far more benign, a string of articles on that matter has flourished over the past few months. I even recall at least one articlethat, already a few months ago, predicted a slumpind Baltic index because of too many new ships coming out of shipyards).
For those looking for BDI prices, you can find a very handy chart (free of charge) on:
http://www.wikinvest.com/index/Baltic_Dry_Index_-_BDI_(BALDRY)
Great comments…..everyone clearly put a lot of time and thought into these, and the efforts are much appreciated. And that goes equally for the comments AND the critiques.
A lot of folks asked about where to go to access information about the Baltic Dry Index. Article author Jack Barnes asked me to post this address for those of you who are interested…..
http://www.eoddata.com/StockQuote/INDEX/BDI.htm
If you have other questions, feel free to post them here. Better yet, send them to us at the "Money Morning Mailbag," at mailbag@moneymappress.com.
Until next time….
Respectfully yours;
William (Bill) Patalon III
Executive Editor
Money Morning
[…] in Japan July 14, 2010The BP Relief Wells … And the Two Nightmare Scenarios to Fear July 16, 2010The Baltic Dry Index is Shouting "Danger, Will Robinson!" But Are Investors Listening? July 6, 2010History Shows Stock Market Plunge May Just Be Par for the […]
Has anyone done the comparitive data of the bdi of 2007 ( ie the # of tonnage at that time and the # of new tonnage being introduced to the system at that same time ) to the same equation in July 2010. P.S. on a percentage basis. I think that might give everyone a more focused comparison to analyze. Jerry
[…] in Japan July 14, 2010The BP Relief Wells … And the Two Nightmare Scenarios to Fear July 16, 2010The Baltic Dry Index is Shouting "Danger, Will Robinson!" But Are Investors Listening? July 17, 2010Money Morning Mid-Year Forecast: India is on the Path to Double-Digit Growth July 20, […]
[…] the stock markets both here and abroad hit the bottom. Much like the Baltic Dry Index (BDI) thatwe explored in a popular Money Morning essay several weeks ago, the WLI also "called" the economic bottom […]
[…] economic sources that are pointing south: the Economic Cycle Research Institute (ECRI) and the Baltic Dry Index (BDI). The ECRI charts weekly changes in leading economic indicators, and is extremely good at calling […]