

The warning signs of a stock market crash in 2014 are getting harder and harder to ignore...
Several prominent market watchers, including Ben Inker, head of the asset allocation group at GMO, and John Hussman of the Hussman Funds, say the markets are about 40% overvalued.
Last week, Yale Professor Robert Shiller, a Nobel-prize winning economist, expressed concern that stocks may have gotten ahead of themselves.
"I am most worried about the boom in the U.S. stock market. Also because our economy is still weak and vulnerable," Shiller told the German magazine Der Spiegel.
These analysts referenced a number of crash indicators nearing "warning" levels, which we've detailed in the charts below.
Of course, none of this means investors should run out and sell every stock they own in a blind panic. But it does mean investors absolutely need to proceed with caution, choosing stocks in stronger sectors and using trailing stops. [Here's a detailed plan on how to protect your money from a stock market crash.]
Now let's take a look at those seven charts pointing to a stock market crash in 2014...
The Seven Charts That Warn of a Stock Market Crash 2014
These charts provide worrisome clues that the stock markets are seriously overvalued and due for a big correction:
Stock Market Crash Chart #1: Shiller's CAPE Ratio

The cyclically adjusted price/earnings (CAPE) ratio, created by Robert Shiller, smoothes out the price/earnings (P/E) ratio by averaging it over 10 years. Now at 24.42, the CAPE is substantially above its long-term average of 16. And more ominously, the CAPE has only been higher twice - at the end of the 1920s, just before the Stock Market Crash of 1929, and at the end of the 1990s, just before the dot-com stock market crash.
Stock Market Crash Chart #2: The VIX

The VIX measures market volatility, and is commonly referred to as the "fear index." A higher VIX indicates more concern among investors and often accompanies downturns. As the markets headed toward the 2009 lows, the VIX was between 40 and 60. But it's down 28% in 2013 and is currently hovering around 14. Similar measures also indicate little concern among investors of a market crash. High levels of confidence in the markets often precede crashes.
Stock Market Crash Chart #3: NYSE Trading Volume
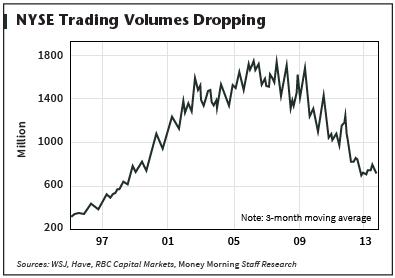
The markets have reached record highs on declining trading volume, which indicates weakness. This tells us there are fewer and fewer buyers, which will make it harder for stocks to continue their push to new heights. And when things go south, a lack of buyers will only accelerate the decline.
Stock Market Crash Chart #4: Margin Debt
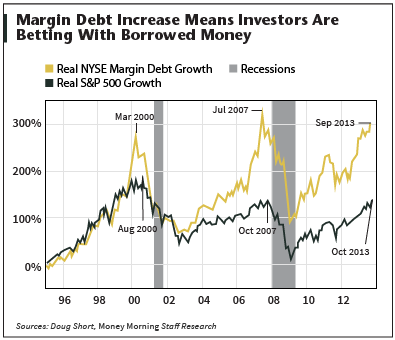
Another catalyst of a market crash is when too many investors are using leverage - borrowing - to buy stocks and capture expected gains. When a bull market turns bearish, such investors need to get out quickly to avoid losses they can't afford. That tends to accelerate the speed of a crash, and feeds on itself. Right now we're at dangerous levels of margin debt, which could turn a mild correction into something worse.
Stock Market Crash Chart #5: Profit Margins
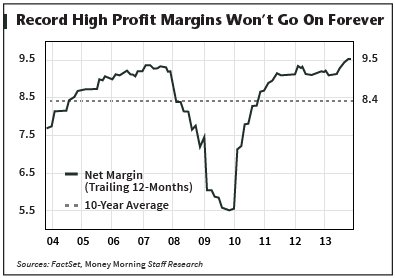
Profit margins are near record highs and significantly above their 10-year average. Given the overall weakness in the U.S. economy, and in particular consumer spending, this doesn't appear sustainable. What's more, Hussman says that corporate profits as a share of gross domestic product are 70% above their historic norm. When profit margins revert to the mean - which they almost surely will - stock prices will tumble.
Stock Market Crash Chart #6: Earnings Forecasts
Strong earnings have been a primary driver of the markets over the past year, but estimates for earnings have been dropping. Many companies that reported good earnings in the third quarter also lowered guidance for the fourth quarter. Slowing growth spells trouble for the current rally.
Stock Market Crash Chart #7: Price vs. Earnings
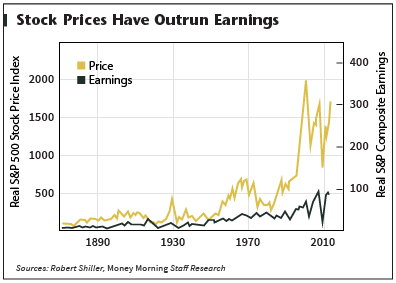
In recent years, the divergence between earnings and stock prices has grown disturbingly wide, which is risky enough. But prices have a tendency to closely track earnings - and more dramatically so as the gap between the two has grown larger. If earnings do slow in 2014, which the previous charts appear to suggest, that could be enough to trigger a stock market crash.
Money Morning Chief Investment Strategist Keith Fitz-Gerald blames this gap on the U.S. Federal Reserve's easy money policies.
"The markets are up 83% since Q2 of 2009, but consumer spending is up only 9%," said Fitz-Gerald. "That huge divergence tells me that the stock market has enjoyed the liquidity boom but the consumer has not. And it means one of two things: either market prices have got to come down, or earnings have to go up. This is a classic sign for technical traders that there's a danger sign flashing on the dashboard."
Speaking of the Fed and how it's manipulated our stock market - ever heard of the Taylor Rule? Not many people have, and the folks at the U.S. Federal Reserve would prefer to keep it that way. The Fed realizes that if most Americans became aware of the Taylor Rule and what it means, they'd probably be tarred and feathered. That's why you need to see this now...
Related Articles:
- Money Morning:
The Real "Pin" That Could Pop the Stock Bubble - John Hussman:
An Open Letter to the FOMC: Recognizing the Valuation Bubble in Equities - Business Insider:
I Think There's a Decent Chance Stocks Will Crash - MarketWatch:
Robert Shiller 'Most Worried' About 'Boom' in U.S. Stock Market

About the Author
David Zeiler, Associate Editor for Money Morning at Money Map Press, has been a journalist for more than 35 years, including 18 spent at The Baltimore Sun. He has worked as a writer, editor, and page designer at different times in his career. He's interviewed a number of well-known personalities - ranging from punk rock icon Joey Ramone to Apple Inc. co-founder Steve Wozniak.
Over the course of his journalistic career, Dave has covered many diverse subjects. Since arriving at Money Morning in 2011, he has focused primarily on technology. He's an expert on both Apple and cryptocurrencies. He started writing about Apple for The Sun in the mid-1990s, and had an Apple blog on The Sun's web site from 2007-2009. Dave's been writing about Bitcoin since 2011 - long before most people had even heard of it. He even mined it for a short time.
Dave has a BA in English and Mass Communications from Loyola University Maryland.