I'm not an alarmist.
The sky isn't falling. But the same may not be true for stocks.
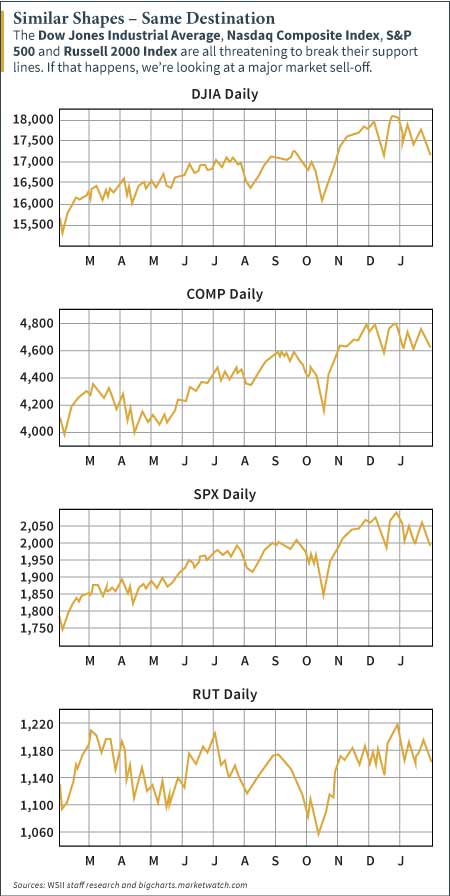
And I am concerned. To see what I'm talking about, just take a look at the stock charts below. Take a good look at each one.
See if you see anything in them. See if you can see what I see.
Then I'll tell you what I see and what I'm afraid of...
Do You See What I See?

They're all different market indexes. They all look the same. Don't they?
And they're not the only indexes that look this way - check out the Dow Jones Transportation Average and the PHLX Semiconductor Index as well.
Not only do they look the same, but they're all pointing to the same place - a danger zone.
On every graph, on the right-hand side, after the big drop in October, you can draw a pretty straight line under the dips on the right from the middle of December to now.
What is that line? That's "support." Every one of those charts and most individual stock charts look like these indexes. They all have the same support line.
What's the problem?
If they break that support line - if just enough of them break their support lines - they're all going down.
The correlation is frightening.
That's what I'm worried about.
A major market sell-off can happen. We're at that point - we're hanging on to support.
Then again, support can be support. And we could bounce higher and make new highs.
When I wrote this heading into the markets' close on Feb. 2, 2015, after being down triple digits that morning, we went up triple digits.
So far, so good. Support levels are still holding.
However, I'm more concerned about preserving my capital than risking it at this juncture.
Here's what I suggest you do...
Right about now would be a good time to check your stocks, to put down some stop-loss orders, if you don't have them down already.
Now is the time where I like to put on trades that will make money if the markets fall.
We're down with our stops in my trading services - Short-Side Fortunes and Capital Wave Forecast - and we've got some neat positions that will make a ton if the markets do fall out of bed.
And if they bounce off support and head higher, we'll get out of our downside plays, take off some of our hedges, and let our portfolios bask in the sunshine of a rising market.
But, like I said up top, the truth is that I am concerned.
That's all. I told you I'd let you know if I became uneasy with how the market is acting.
I'm saying it now.
Casino Capitalism in Action: The Fed and other central banks printed money and steered it directly onto banks' balance sheets so they wouldn't be insolvent. But the central banks did all they can do a while ago - they're just using ghost funds now. Here's why the time to sell everything is approaching fast...
About the Author
Shah Gilani boasts a financial pedigree unlike any other. He ran his first hedge fund in 1982 from his seat on the floor of the Chicago Board of Options Exchange. When options on the Standard & Poor's 100 began trading on March 11, 1983, Shah worked in "the pit" as a market maker.
The work he did laid the foundation for what would later become the VIX - to this day one of the most widely used indicators worldwide. After leaving Chicago to run the futures and options division of the British banking giant Lloyd's TSB, Shah moved up to Roosevelt & Cross Inc., an old-line New York boutique firm. There he originated and ran a packaged fixed-income trading desk, and established that company's "listed" and OTC trading desks.
Shah founded a second hedge fund in 1999, which he ran until 2003.
Shah's vast network of contacts includes the biggest players on Wall Street and in international finance. These contacts give him the real story - when others only get what the investment banks want them to see.
Today, as editor of Hyperdrive Portfolio, Shah presents his legion of subscribers with massive profit opportunities that result from paradigm shifts in the way we work, play, and live.
Shah is a frequent guest on CNBC, Forbes, and MarketWatch, and you can catch him every week on Fox Business's Varney & Co.


