


My wife and I were just at a children's birthday party. You know, the kind where everyone gets together to sing "Happy Birthday," and then the adults drift off into their own groups to chat.
Naturally, I fell in with a group of several wealth managers, and you'd better believe we started talking about the markets.
When the subject turned to oil shares, you could have heard a pin drop.
You see, some of those folks could be looking at a mighty lean year, depending on their oil exposure.
But as we know, there's an opportunity to make money as share prices fall. Today I want to show you how to book a quick and easy 30% gain on some very big, very liquid oil shares, even as the stock tumbles down.
It's the perfect energy play for markets like this.
Profit While We Wait for the Oil Bull to Resume
There are always plenty of factors to consider when oil is in a temporary downtrend like this.
It could be that the post-earnings misses from Exxon Mobil Corp. (NYSE: XOM) or Chevron Corp. (NYSE: CVX) are causing oil stocks to move lower.
But it usually boils down to simple supply and demand. Demand for fossil fuels like oil is still very high, but when a huge consumer like China begins an economic slowdown, there's a knock-on effect throughout the global oil market.
Although output numbers are dropping slowly, there's simply a bit too much oil on the market right now - a few too many tankers sailing the seas and looking for a port.
Now, oil shares will rebound eventually. The Money Calendar, which tracks the best upcoming money-making opportunities in stocks, suggests that the downturn will last another three to five weeks yet, so dedicated oil bulls may want to hang back until after Labor Day. Personally, I like to catch the bull train a little late than hop aboard too early.
But... the beauty of this trade I'm about to show you is that we don't even need to worry about when the bull trend will resume.
For now, the oil pattern is "down," and we aren't going to fight that. Take a look at this recent Money Calendar bull-bear list of bearish trade opportunities...

You see there that three of these four indicators are in the red, which indicates a high probability of patterns going down.
Those red companies are in the oil sector: oil field services, oil exploration, or production.
Our opportunity lies in Schlumberger Ltd. (NYSE: SLB).
For some deep perspective, have a look at this 10-year chart for Schlumberger running over the same 30-day period, from the third week of July to the third week of August.
Now, it's important to note that this chart is a little different - it shows the profits you would see if you were short Schlumberger.

Notice that in nine of the last 10 years, SLB shares dropped an average of nearly 5 points during this 30-day period. 2011 was a monster move down, while 2012 was the only time in 10 years that SLB stock actually went up in this time frame.
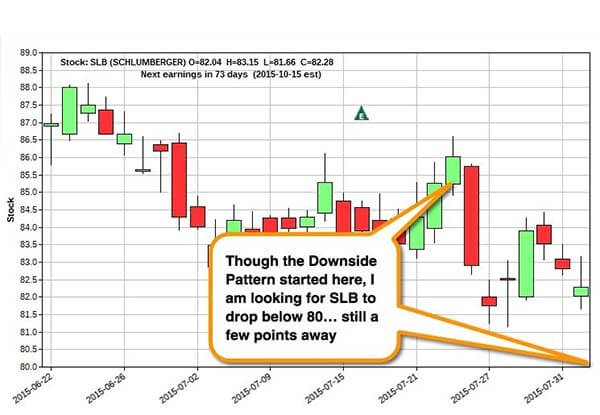
Now this is a more conventional chart for Schlumberger over the last 30 days...
")
Click to Enlarge
It's following the same pattern! And Schlumberger is continuing to hit new lows on its way down to a target price of $78.
There's plenty of money to be made on that short trip down, so we can jump on this opportunity and buy-to-open SLB Aug 2015 $84 puts (SLB150821P00084000).
Those puts are trading at around $2.63 at this writing. And when Schlumberger hits $80 on its way down to $78, those puts will be good for a quick, easy 30% gain.
About the Author
Tom Gentile, options trading specialist for Money Map Press, is widely known as America's No. 1 Pattern Trader thanks to his nearly 30 years of experience spotting lucrative patterns in options trading. Tom has taught over 300,000 traders his option trading secrets in a variety of settings, including seminars and workshops. He's also a bestselling author of eight books and training courses.