


The year is wrapping up, and we're just days away from 2016.
This means it's time to think about your New Year's resolutions.
Now I know...
Most people give up on their resolutions within the first few months of the new year.
As a matter of fact, according to a recently published article by Forbes, only 8% of people actually achieve their New Year's goals.
The other 92% of people fail because they set too many goals that are too complex and too unrealistic to achieve.
So I'm going to give you the only New Year's resolution you need:
Make twice the profit you made in 2015 by Dec. 31, 2016.
And today, I'm going to show you the secret to reaching that goal...
Now, we've recently been talking about momentum indicators. I showed you how MACD can measure the strength and duration of a trend and how you can use stochastics to time your options trades.
Both of these are terrific tools for showing you the direction a stock's price is heading.
But right now, I'm going to show you the absolute best momentum indicator you can have in your trader's toolbox...
And how you can use it to help you kick your profits into high gear in 2016.
Let's get started...
This Momentum Indicator Is Absolutely Critical for Spotting the Trend and Banking the Profit
 Stock and options traders will often try to tell you that picking the absolute top and bottom of a trend is a very difficult thing to do - at least consistently.
But as I've said before, anyone who tells you that he or she found the absolute top or bottom of a stock is not being honest with you.
So the focus for today isn't on trading absolute tops and bottoms.
Instead, I am going to talk to you about another a technical indicator that measures the points in a trend of a stock that signal where the battle between the bulls and the bears may be reaching a turning point.
It's similar to what I recently showed you - MACD and stochastics - in that it's a momentum indicator used to assess oversold and overbought zones. Remember that momentum is the rate of the rise or fall in the price of the stock.
And it's called the relative strength index (RSI). RSI computes momentum by looking at the ratio of higher closing prices to lower closing prices.
It compares recent gains to recent losses, and to what extent they are, in an attempt to find out if the stock is in an oversold or overbought condition.
RSI is critical for traders to know in order to determine the best income-producing trades based on these gains and losses.
It's a means for a technical trader to find a point in the trend that may be an ideal setup for an income-producing trade idea.
Like MACD and stochastics, RSI is a momentum oscillator that's best used in sideways trends...
So the idea is that when the technical momentum indicator is oversold (yet is coming out of the oversold zone to the upside), the stock should have been in a downtrend or basing pattern showing it's likely to start an uptrend in price.
For those of you who may not know what a sideways trend is, it simply describes the horizontal price movement caused when the supply and demand of a stock is just about equal. It's also commonly referred to as a horizontal trend.
You Can Predict the Moment a Stock Will Move as Long as You Find These
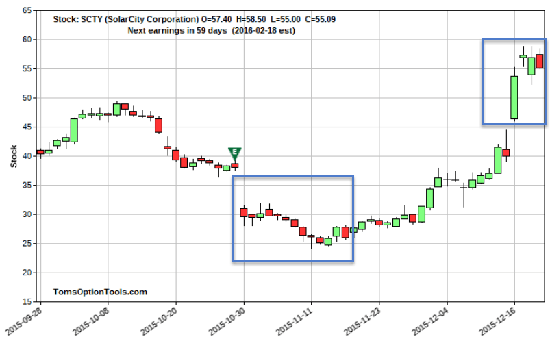
As you'll recall, last week I mentioned that stocks can be deemed oversold and overbought. Remember that a stock is deemed oversold when there is an anticipation that the markets believe the stock is at a better value than it was at a higher price. A stock is deemed overbought when traders think the stock price has been pushed too high (or to a price where the buying will eventually stop).
The RSI ranges from 0 to 100. The oversold zone is typically 30 to 0, which is where the stock tends to be considered undervalued. The overbought zone is typically 80 to 100, which is where the stock tends to be considered too pricey or overvalued.
You can see the oversold and overbought zones in the images below.
RSI is calculated using the average gains and average losses of a stock over a specific period of time. Typically, the RSI uses a time frame of 14 periods.
It's calculated using the following formula to create an oscillator that moves between 0 and 100:
RSI = 100 - 100 / (1+RS)
*RS= Average gains/average losses
Using graph below, you can see where a stock is in the overbought and oversold zones.
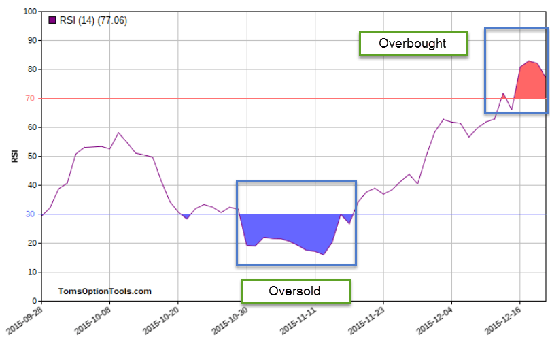
Since a stock can stay in an overbought or oversold zone for an extended period of time, it's best to try and initiate trades when the momentum indicator is breaking out of these zones.
The RSI is essential to finding these turning points because it shows that a trend is changing and is likely to reverse or start to gain momentum in the opposite direction.
You should consider a bullish trade when the RSI comes up out of an oversold zone.
You should consider a bearish trade when the RSI comes down out of an overbought zone.
Stocks that have made more or stronger positive changes have a higher RSI than those stocks with stronger or more negative changes.
The key to doubling your money in 2016 is finding these turning points and using them to initiate your options trades.
As a momentum indicator, RSI is the ultimate secret to knowing a stock's expected price move. In turn, you will know exactly what you need to take those profits you made in 2015 and double them in 2016.
But we can't talk about using RSI unless we also talk about two additional indicators that will help you find potential reversals in an upward or downward trend and will also alert you to a possible change in momentum.
Later this week, I'll show you both of these.
[mmpazkzone name="in-story" network="9794" site="307044" id="137008" type="4"]
Follow us on Twitter @moneymorning or like us on Facebook.
Become a Better Trader in 2016: The bull market had a fantastic run, but it died in 2015. This is great for traders, who'll be able to target opportunities with stratospheric potential returns. Now's the perfect time to review your trading tactics and develop a plan that'll make money - and plenty of it - in 2016...
About the Author
Tom Gentile, options trading specialist for Money Map Press, is widely known as America's No. 1 Pattern Trader thanks to his nearly 30 years of experience spotting lucrative patterns in options trading. Tom has taught over 300,000 traders his option trading secrets in a variety of settings, including seminars and workshops. He's also a bestselling author of eight books and training courses.