Gold continues to be resilient in a year marked by stock volatility.
The gold price today is up $11.50 to $1,275.30. That's a year-to-date gain of about 18%.
Not only has the gold price managed to remain above the $1,200 level, but it has been decidedly strong, not even testing below that level for the past couple of weeks.
Just take a look at what gold has been doing this week...
On Monday, Feb. 29, gold prices opened at $1,230 and steadily climbed higher throughout the day to close at $1,238. Tuesday, gold fell to $1,231, but Wednesday saw renewed strength. Gold opened at $1,230 and soon climbed to $1,240, maintaining most of those gains to close at $1,239.
 But yesterday was the standout. Gold prices started NY trading at $1,245 and quickly surged to $1,255 by midday, touching as high as $1,257.
And this action has come despite recent momentum taking the S&P 500 higher over the past week.
Now gold has also produced two positive technical signals that point to further strength. Overall, the trend looks encouraging for where gold prices are headed in 2016 - let's take a look.
How the Gold Price Today Got to This Point
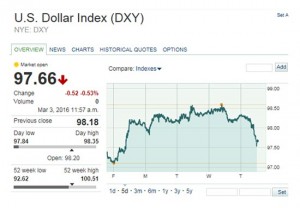
Helping support the recent 2016 gold price is the action in the U.S. Dollar Index (DXY).
 As the accompanying chart shows, the DXY has bounced back from just above 97, but appears to have stalled just above 98.50, as it recently reversed from there to its current level near 97.50.
On the technical side, gold has exhibited a couple of positive signs I'd like to delve into in some detail.
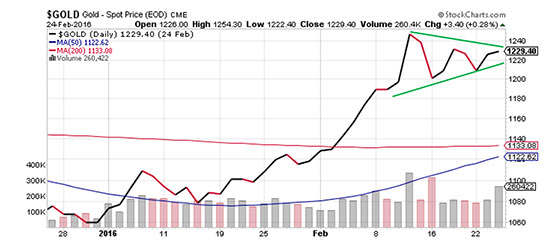
The first is the flag pattern I discussed last week.
Here's how it looked then:
[mmpazkzone name="in-story" network="9794" site="307044" id="137008" type="4"]

At the time I said the gold price had developed a pennant pattern and that as we approached the apex of the triangle, we'd know better if gold were to head higher or lower.
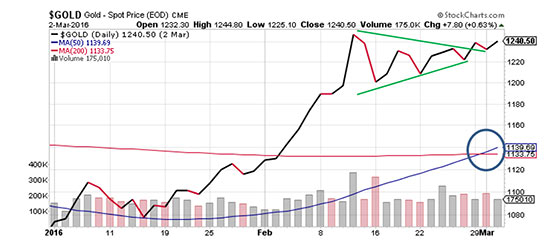
Well here's how that looks today:

As you can see, the gold price has broken out of the triangle to the upside, which is a bullish signal. I believe it's still early to say with certainty if that strength will be maintained, but it is in fact a bullish technical signal.
The other bullish signal is a "golden cross." That's when the 50-day moving average crosses above the 200-day moving average. For gold, it's the first time that's happened in almost two years. I've circled that event in the chart above. A golden cross is a signal that we could be heading into a sustained bull market in the price of gold.
And a surprising group is jumping on board with gold's bullish trend...
More Support for the Gold Price Today
Big banks aren't typically friends of gold - and they've been changing their tune.
Just recently, Deutsche Bank told its investors they felt the time was right to buy gold, saying in a note to clients, "Buying some gold as 'insurance' is warranted," and that gold "deserves to be trading at elevated levels versus many other assets."
Another point to consider is how the gold price has also outperformed other commodities.
As of last week, gold had remained the best-performing commodity included in the S&P GSCI (Goldman Sachs Commodity Index), which is made up of 24 commodities over the past month.
Real interest rates having turned negative, as Treasury yields have come down and inflation has risen, are likely one of the main drivers for gold right now. If they remain so and possibly go even further into negative territory, that's only likely to help the gold price head even higher.
Stay informed on what's going on with the price of gold today and all days by following us on Twitter @moneymorning or liking us on Facebook.
The Essential Guide to Buying Gold and Silver: Precious metal investing is widely regarded as the best "crisis insurance" for your portfolio. This guide gives you everything you need to know about the best stores of value in history, gold and silver. Read more...


