


Last week the U.S. Federal Reserve decided against raising interest rates four times this year, opting for just two hikes instead.
Some analysts point to this recent change of mind as proof of an impending recession. Others state there's no strong possibility of one.
But I'm not going to wait to find before I make my trading decisions. And you shouldn't either.
All you need is this very simple strategy to find the best trades based on the U.S. economy.
And I'm going to show you right now...
Match Your Trades to the Strongest Economic Industries Using Sector Rotation Analysis
Sector rotation analysis is an interesting investing strategy in the markets because it helps identify options trading opportunities. This strategy is based on the observation that not all stocks move together at the same time and that there are times of the year where certain stocks in certain industries are found to provide better price moves - and better returns - than others.
A sector is a group of stocks in one industry. When one sector is determined to be the best place to invest, portfolio managers, money managers, and investors start putting their money to work there. And that influx of buying can propel stock prices higher.
The money that's used to invest in certain sectors may come from the liquidation (or sale) of the stocks in which those portfolio managers and investors were previously invested. And this liquidation of stocks within the "unfavorable" sector could drive those stock prices lower.
Let's take a look at the three major components of this strategy...
Sectors
A sector is a group of companies, publicly traded or not, that share a common product or service. You can look at large sectors such as retail, banks, and technology. As you can probably imagine, there are many companies that fall under these classifications.
Within these larger sectors, you can break groups of companies down into smaller sectors called sub-sectors. For example, you can break the technology sector into even smaller groups, such as semiconductors, software, and electronic equipment.
Economic Cycle
At some point in your life, you've probably heard of the four stages of the economic cycle: expansion, peak, recession, and trough.
Market moves follow similar stages of full recession, early recovery, full recovery, and early recession, and the markets can remain in any of these stages for years before moving on to the next.
Take a look at how nine different sectors react to different market and economic stages:
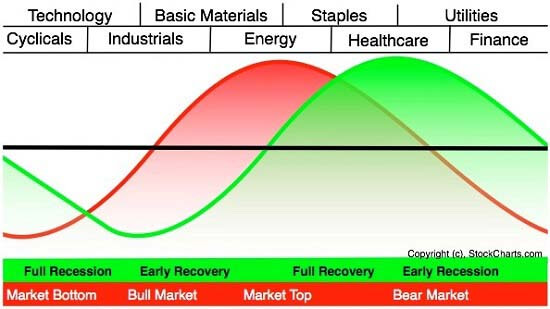
Source: stockcharts.com
As you can see, there are stocks, and consequently sectors, that perform better in these different phases of the economic cycle.
In a market-bottom environment, consumer discretionary stocks (referring to the companies that sell nonessential goods and services, like retailers) typically turn higher. Technology stocks follow the upward movement next, then industrial stocks, then basic materials, and so on from left to right in the image above.
Sector Rotation
 By analyzing the sectors and economic cycle, you can look to time the next stage of the cycle where one sector starts selling off. After identifying the sector(s), you can start selling these stocks in accordance with your allocation model and use that money to invest in other stocks within a sector that's poised to take off on a bullish run.
In an article on exchange-traded funds (ETFs) that I wrote:
"So instead of going through the daunting task of finding the needle in that haystack, let's focus on the haystack itself: the exchange-traded fund (ETF)..."
And that's what I want to emphasize again right now.
Instead of trying to find a bunch of individual stocks to invest in - which can cost you much more than you'd like - take some time and research the ETFs in which you can invest.
Or better yet... look to trade options on them.
Using the sector rotation analysis strategy, you can identify the times of the year that you believe money will rotate from one sector to another. And this is where you will want to look for the corresponding ETFs or group of stocks in a sector to find your trade candidates.
As you've seen in our Power Profit Trades case studies and as my Money Calendar Alert readers have seen, I look for historically-based, seasonal patterns during specific date ranges that have moved higher or lower in at least nine of the past 10 years. I also look for the average profit (or price move) per share that those stocks made.
I also look at the list of candidates within a group of stocks that have bullish or bearish sentiments during the same period of time. And this is a real basic form of sector rotation analysis. For example, if the technology sector shows a group of stocks that are expected to make bullish moves, then I will lean toward a trade in that sector. If there is a time when one industry, say technology, that has a handful or more stocks showing anticipated bullish moves, I will lean towards a trade in that sector.
The tool I use to find these reliable bullish and bearish patterns, as well as potential price moves, regardless of the economic cycle we're in, is my Money Calendar.
When a handful or more of stocks in a particular sector show a Money Calendar seasonal bias to the upside, this tells me that money is rotating into that sector. And when I see the money flowing into one sector, I follow that money to find the profit opportunity. Conversely, I look for bearish trade opportunities when I see money flowing out of a sector.
You can do the same by looking for the primary 11 sectors and the ETFs for those sectors. A great place that features this type of analysis and shows you the list of holdings making up those ETFs is sectorspdr.com. Here's an example of a list of holdings that you'd see:
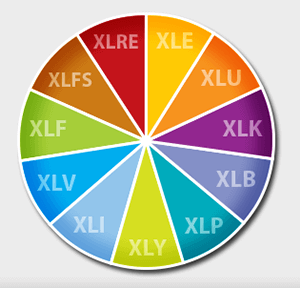 Source: sectorspdr.com
Follow Money Morning on Facebook and Twitter.
[mmpazkzone name="in-story" network="9794" site="307044" id="137008" type="4"]
Double Your Money on Your Broker's Dime: We've had a nice rally lately, but there are only a few more weeks of the bulls. And that means right now is the perfect opportunity to make use of this easy strategy - and increase the size of your portfolio while "using other people's" money to double your profits...
About the Author
Tom Gentile, options trading specialist for Money Map Press, is widely known as America's No. 1 Pattern Trader thanks to his nearly 30 years of experience spotting lucrative patterns in options trading. Tom has taught over 300,000 traders his option trading secrets in a variety of settings, including seminars and workshops. He's also a bestselling author of eight books and training courses.