Is the correction in the price of gold finally over?
That's the question everyone watching this space wants answered.
We've already seen gold prices trade below $1,200 on an intraday basis. But that was short-lived as buyers quickly came in to provide support.
A number of indicators keep pointing to possible gold price weakness in the weeks ahead. And don't forget about the Fed, which keeps reminding us its finger is on the rate hike trigger.
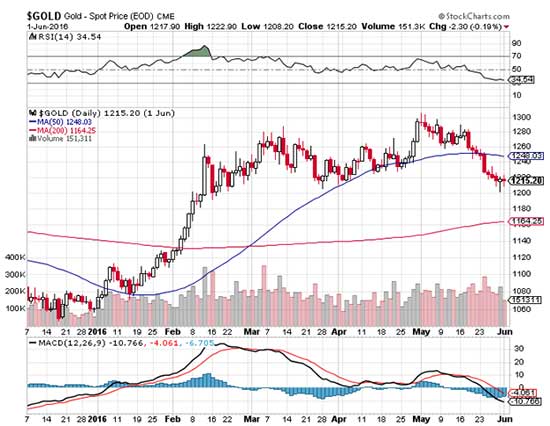
Since peaking at $1,300 in late April, the price of gold has given back about 7% of its gains. Last week, I gave you my gold price targets, the first of which we've already hit.
This week, we'll look at some other indicators suggesting some headwinds still lie ahead for gold prices and gold stocks.
Before we get into these factors, let's look at how today changed gold's previously uneventful week...
Here's What's Been Moving the Price of Gold This Week
 Thanks to a surge in the U.S. Dollar Index (DXY), the gold price struggled to hold gains at the end of the previous trading week.
On Friday, May 27, gold opened for trading and immediately headed south due to a 0.6% jump in the dollar. Gold prices fell 0.5% to $1,213 on the day.
The metal breached an important level over the weekend. Late Sunday night, the price of gold briefly dipped below the $1,200 level. However, it rebounded from the lows during the Memorial Day session to close at $1,205 for a loss of 0.7%.
Gold prices posted their first gain of the week the following day. On Tuesday, May 31, the metal climbed 0.8% to settle at $1,215.
By Wednesday, weakness had returned once again. After jumping to $1,219 at the open, the gold price fell to $1,213 for a 0.2% loss.
On Thursday, June 2, the metal traded flat throughout the day despite the strengthening dollar index. While the DXY gained 0.1% to 95.55, the price of gold declined only 0.03% to $1,212.60.
But we're seeing a massive rise in the gold price today thanks to the disappointing jobs report...
Earlier this morning, the U.S. Labor Department reported the worst monthly job gain since 2010. The economy added only 38,000 jobs in May, far below the monthly average of 200,000 over the last two years. Despite the weak job growth, the U.S. unemployment rate fell to 4.7%.
The bad jobs report indicates a slowing economy, which would convince the U.S. Federal Reserve to hold off on a rate hike in June and July. Low interest rates are a boon for gold because they weaken the dollar. As of 10:15 a.m., gold prices today (Friday, June 3) are up 2.6% to $1,244.20.
Although the price of gold is rallying today, the metal is still in the early stages of a correction. After all, prices are down 4.2% from their April high.
And I see gold prices falling toward two specific price levels in the coming weeks...
This Is What Will Move the Price of Gold Toward Our Two Targets
[mmpazkzone name="in-story" network="9794" site="307044" id="137008" type="4"]
Now that gold has begun its correction, let's examine the factors that might send it in a particular direction...
First, let's consider the Commitment of Traders (COT) reports on gold futures, especially as it relates to the "smart money" commercial traders.
After spending a few weeks near extreme levels of 300,000 net short contracts, these commercial traders recently reduced that exposure to about 225,000. Although it indicates they've become slightly less bearish, it's still a large net short position, which protects them from possible gold price drops.
What's more, gold's $100 decline through the month of May also points to negative sentiment. The metal is currently trading below its 50-day moving average and has negative momentum. That's clear from the relative strength index (RSI) and moving average convergence divergence (MACD) indicators, which measure the oversold conditions of gold prices.

With that in mind, I still see potential for the gold price to test lower levels in the weeks ahead.
I have my eye on two price targets: $1,180 and $1,160.
As for gold stocks, the bullish percent indicator also points to further weakness ahead.
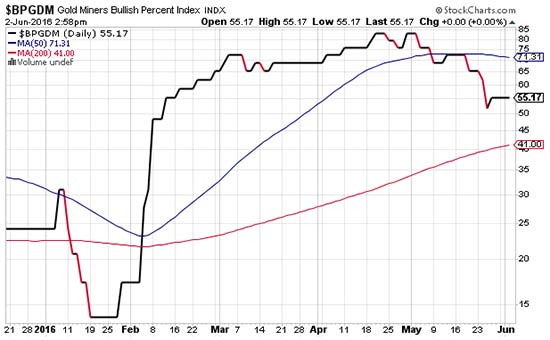
The bullish percent index for gold miners (BPGDM) helps us measure how overbought or oversold gold mining shares are at any given time. The index indicates what percentage of stocks is trading in bullish versus bearish mode.
A reading above 80 points shows overbought conditions, whereas a reading below 20 points shows the metal is oversold. Once the index reaches those levels then reverses, you have the makings of a sell or buy signal.
This chart shows where the index has moved this year...

As gold peaked at $1,300, the BPGDM also made a double top in late April/early May.
The index currently sits at 55 and will likely move lower to get sentiment bearish enough to set the stage for a new uptick in gold stocks. And that could take some time to play out.
For now, I will continue to track these indicators to glean some clues as to when the current correction might end.
Stay tuned to Money Morning for more updates on the price of gold in 2016. Follow us on Twitter and like us on Facebook.
How to Make Money from Gold Prices in 2016... Despite gold's recent correction, it's still a must-have asset for your portfolio. That's because the yellow metal serves as the perfect "crisis insurance" when the broader market takes a dip. Here's your guide to investing in both gold and silver this year...


