As hard as it is to believe, we're already halfway through the year.
And on Monday, Alcoa Inc. (NYSE: AA) "unofficially" kicked off second-quarter earnings season, which means that we could be looking at some instability in the markets - despite June's strong jobs report.
Now pundits have mixed opinions of what to expect... Some are calling for a "frightening" earnings season while others are expecting strong results.
Regardless of who ends up being right, we're not immune to earnings "surprises" that could drive the markets higher or lower.
In the first quarter, for example, energy companies shocked the markets by beating their expected earnings by 28.7%. But even so, we saw the largest decline - -56.6% - in the overall energy sector in the first quarter.
So today, I'm going to show you a classic pattern you can use to milk earnings this quarter... surprises and all.
Charting "Old Resistance, New Support" Is the Key to Maximizing Your Profits in Q2
Recently we talking about using trend lines (ascending, descending, and sideways) to establish a support and resistance area on your charts. And as you'll recall, these trend lines are important for establishing supply and demand in the markets - which drives stock and exchange-traded fund (ETF) prices higher and lower.
Remember...
Demand typically comes in at support where people deem the underlying stock or ETF an attractive price to accumulate the stock. Support is the place from where the underlying will typically move higher. Resistance is where supply typically kicks in due to people wanting to sell the underlying stock or ETF holdings to lock in their profit. Resistance is the place where the underlying stock or ETF typically moves lower.
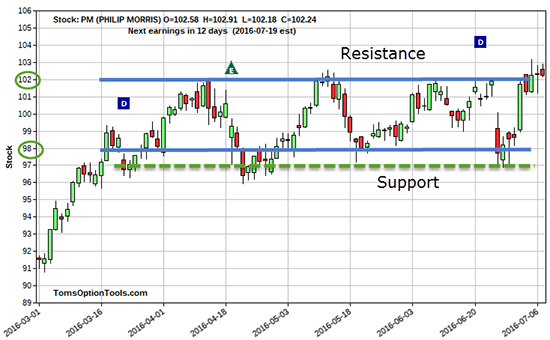
A basic chart pattern establishes the trading range where a stock or ETF trades between a horizontal and consistent support level (at least twice) and a horizontal and consistent higher resistance level (at least twice). Take a look...

You can clearly see a support level at $98 and a resistance level at $102. This trading range (shown with the solid blue lines) is - or was - good for four different $4 moves within the date range that's shown. Now if you wanted to widen the support to $97 (the dash green line), you could... but you'd lose one of those four moves with the $1 tighter range.
Now we've recapped what resistance is. But before we look at the most lucrative pattern you can use to maximize your profits this earnings season, it's important that we take a quick step back and look at support, too.
Support is where you see buyers step in to accumulate stock, and resistance is the price point at which people are happy to get out of their trades and sell their stock. In the chart above on Phillip Morris International Inc. (NYSE: PM), the stock provides opportunities to buy support and sell resistance, taking in $4 per share each time.
As an options trader, you'd consider buying-to-open call options and selling-to-close those options when the stock gets to resistance. Personally, I prefer around a 0.75 delta (which puts the option fairly deep in-the-money [ITM] so that I can get the best return on this price move in PM).
You may have also keyed in on the fact that you could consider buying-to-open put options at resistance. That way, when the stock declines to support, you could consider selling-to-close those puts for a profit.
And if you're looking to be even more proactive in your trading (albeit busier), you could consider both. In this case, you'd alternate between going long on calls of support selling at resistance before going long on puts at resistance to anticipate selling them at support - and profiting off of that up-and-down swing in price.
How to Tell When a Price Trend Is Shifting
[mmpazkzone name="in-story" network="9794" site="307044" id="137008" type="4"]
Here's a classic pattern that's easy to recognize when charting your trades...
When support gets broken to the downside, it means that the stock does not test support but trades below - especially if it breaks below it on substantial volume. When this happens, you can see that the sentiment for that stock is very likely shifting, from bullish to bearish.
Whether the shift is due to a change in the fundamentals, management, or sales (or a combination of all three), the stock price is becoming less attractive at support and is now being sold off, causing a downtrend in price).
You may also see the stock trade below support before bouncing back up or slightly above. It is at this point where traders realize the price is still attractive and continue buying the stock. And those who didn't sell the stock when it first broke support now realize they can get that price when selling-to-close a position, causing a further decline in price on that stock yet again.
And this is a pattern where what was old support has now become new resistance. From there, you can use any number of technical indicators or old price moves to ascertain future price moves if you go long puts or initiate any number of bearish strategies at this new resistance level.
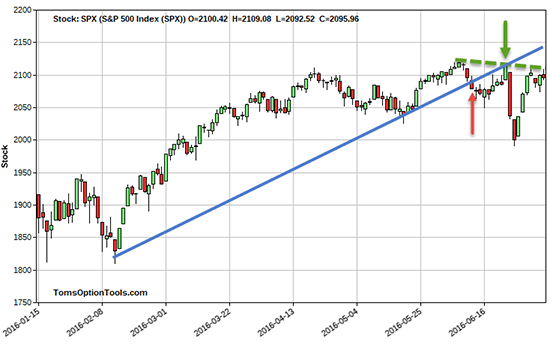
Take a look at the below chart on the S&P 500 (INDEXCBOE: SPX)...

The pattern here shows that the uptrend (indicated by the red arrow) was broken before Brexit. The solid blue line represents an ascending support for SPX.
You can see that SPX traded a bit lower to sideways until it gathered a bit of steam to the upside... But why did the SPX only go up the ascending support line? And why did it stop the day before the referendum results were announced?
It could very well be that technical traders and investors saw that overhead technical trend line and decided that the risks beyond that were not worth taking until after the referendum results came out. It could be for other reasons, too.
But one thing is for sure... it's certainly uncanny how these trend lines work out.
Now, I'm not saying the trend line is the reason the markets went down. The surprising outcome of Brexit is pretty much the reason...
But I wanted to point out how the "old support, new resistance" played out prior to Brexit. I want to help you see ahead of time where you could estimate the retracement higher in price post-Brexit to be on the ascending support line break (the green arrow). And we still have an overhead resistance area (dashed green line) to contend with before we see conviction for the S&P 500 to move higher.
When the resistance level is removed, look for that price to become the new support. And know that this "old resistance becomes new support" pattern will help you know exactly when to initiate a new bullish or bearish options trade.
Follow Money Morning on Facebook and Twitter.
How to Rescue Profits from Volatile Markets: When markets are this turbulent, any news could jeopardize your trades - so timing has never been more crucial. These two indicators will help you confidently (and profitably) exit your trades, no matter the headlines...
About the Author
Tom Gentile, options trading specialist for Money Map Press, is widely known as America's No. 1 Pattern Trader thanks to his nearly 30 years of experience spotting lucrative patterns in options trading. Tom has taught over 300,000 traders his option trading secrets in a variety of settings, including seminars and workshops. He's also a bestselling author of eight books and training courses.


