When following the news over these past several weeks, you'd think that Apple Inc. (Nasdaq: AAPL) and Samsung Electronics Co. Ltd. (OTCMKTS: SSNLF) are the only companies out there making cell phones.
But before the iPhone and Galaxy Note 7 rolled out, there was another provider dominating the smartphone world that's not quite "dead" yet...
I'm talking about BlackBerry Inc. (Nasdaq: BBRY).
Now I know what you're probably thinking... but hang on a second.
Yes, they're losing money year after year. And you probably haven't seen anyone using a BlackBerry in a long time.
But they're establishing a new identity, with a new source of revenue.
And whether or not they succeed depends on this one number...
How BlackBerry's 200-Day Simple Moving Average Will Determine Its Fate
Last November, BlackBerry CEO John Chen said that BlackBerry would stop designing and developing its own smartphones if it couldn't sell between 3 million and 5 million phones to break even. But in the first half of this year alone, it's only sold about 900,000 phones. So, standing by his word, Chen announced on Sept. 28 that BlackBerry is finally done designing and building its own phones.
Don't Miss: This is your ticket to bigger and better returns... and it won't cost you a penny. What are you waiting for? Read more...
Now Chen is working his tail off, I imagine, to re-create BlackBerry's identity from smartphone provider to software servicer. And while discontinuing its hardware sales may result in losses in the short term, you do also want to consider the fact that it no longer faces losses from inventory write-offs. But it's just too early to tell if this will help or hurt BlackBerry (even more) over the long haul.
So the question right now is... do you buy the stock, sell the stock, or stay away from it altogether?
And the answer lies in the 200-day simple moving average (or SMA).
The SMA is a simple technical analysis tool that gives you the average price data of a stock or exchange-traded fund (ETF) over a specific time period (you can tailor it to whatever timeframe you like, making it a good tool for both short-term and long-term trades). You can calculate it yourself by adding up the prices and dividing by the number. So to find the 200-day SMA for BBRY, you'd add up the last 200 prices and divide by 200. If you were looking for, say, the 50-day SMA, you'd add up the last 50 prices and divide by 50.
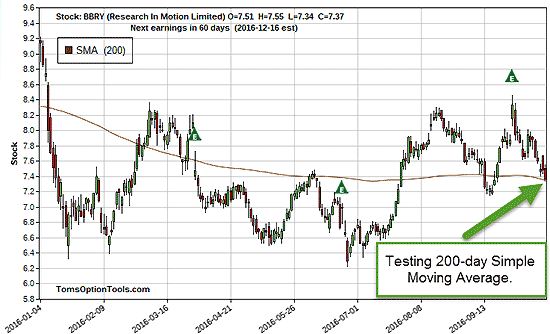
Take a look at BBRY's year-to-date price movements...

From a technical stance, the only positive thing I see here is that it's now nestling on top of its 200-day SMA. And there's just two directions it can go from here that will tell you whether or not BBRY is worth your time and your money:
- BBRY crosses over its 200-day SMA: This is a bullish indicator and signals higher share prices to come.
- BBRY drops below its 200-day SMA: This is a bearish indicator and signals lower share prices to come.
The (Much) Less "Risky" Stock to Put Your Money On
[mmpazkzone name="in-story" network="9794" site="307044" id="137008" type="4"]
Even if BBRY presents some enticing profit opportunities, there's no doubt that the number of "ifs" surrounding the company could be off-putting to you. So if you're looking for another provider (NOT named Apple or Samsung) to put your money on, consider Alphabet Inc. (Nasdaq: GOOGL).
Thanks, in part, to Samsung's exploding phones, Google's been hungry to take over the title of Apple's "number one contender." And with the successful new release of the Google Pixel phone, it's ramping up the advertising and marketing - which could bode extremely well for it this holiday season.
Here's a look at GOOGL stock's year-to-date price movements...

Right now, the stock is well over its 200-day SMA, which speaks highly of the bullish direction the stock looks to be heading.
Keep in mind, though, that GOOGL is one of the more expensive stocks out there. And right now, it's trading at $826.58. So if you don't want to spend nearly $1,000 of your hard-earned cash on one single share of GOOGL, options could be your best answer. Options will let you essentially "rent" 100 shares of the stock so that you can participate in its profits without that hefty cost.
And while I'm not recommending a specific trade on GOOGL, long-term equity anticipation securities (LEAPS) or spread trades with December or January expirations could offer you the most bang for your buck.
This Is the Best "Retirement Stock" of 2016... And the good news is, it's trading for "pennies." But it won't be for long... its revenue is set to surge 4,709%. Learn the details of this $5 stock today while it's still "on sale." Read more...
Follow Money Morning on Facebook and Twitter.
About the Author
Tom Gentile, options trading specialist for Money Map Press, is widely known as America's No. 1 Pattern Trader thanks to his nearly 30 years of experience spotting lucrative patterns in options trading. Tom has taught over 300,000 traders his option trading secrets in a variety of settings, including seminars and workshops. He's also a bestselling author of eight books and training courses.


