The first election I can clearly remember was Johnson vs. Goldwater in 1964. I know what you're thinking - no, I don't feel that old.
I was not yet school age, sitting in the back of our white Chevy Nova station wagon, just taking it all in. I can clearly remember my mom and dad discussing the election and why they liked their candidate. They were still discussing it when we went to the local polling place.
The main thing I remember about that impromptu, front-seat Johnson-Goldwater debate was how civil and reasonable mom and dad were; they were both passionate supporters of their candidate, but of course there were none of the emotional outbursts or attacks that have come to define this election.
And 12 presidential elections later, as I sit at my computer typing, I'm amazed. This is - bar none - the craziest presidential election of my life. It seems like the one thing anyone can agree on is that this contest has featured the two most disliked candidates in the history of U.S. presidential elections.
And that's not just a feeling. Numerous polls have confirmed this thought dating all the way back to 2015.
I mention all this because it has everything to do with how the market will move in the next week.
Let me explain...
The Markets Don't Like Unanswered Questions
Even if you think Secretary Clinton is untrustworthy or corrupt (the two top reasons respondents gave for why she is unlikeable), when candidate Clinton was far ahead in the polls, the market were stable and moving up.
As candidate Trump (who has polled as unlikeable for perceived sexism, racism, and myriad other reasons) has gained ground, markets have dropped.
That's because the word that traders fear has come roaring back into play: uncertainty.
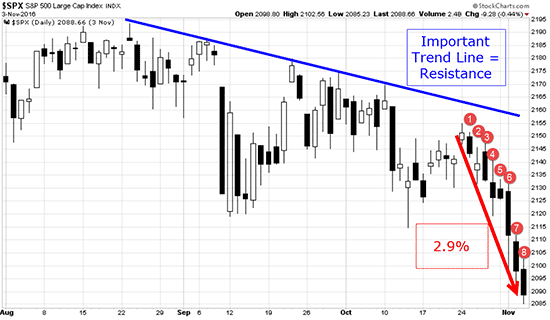
And that uncertainty has led to a very interesting occurrence - eight straight down days in the S&P 500.
And while that down period has been much more prolonged than normal pullbacks, it has also been very shallow. It's been less like a cliff dive and more like the air leaking out of a tire. This is what it looks like on the chart:

When you get eight straight down closes on the S&P 500, some interesting things start to happen.
For one thing, there have been 28 instances of such long declines since 1928, with an average loss of 7%.
However, this current slump has seen us give up just 2.9% - the individual daily drops have been less than 1%, and at some point during each of these eight days, the markets have been positive.
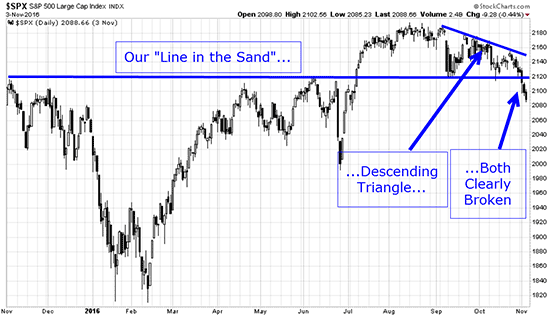
Like I said, this drop has been shallow, but it nevertheless has cracked our "Line in the Sand," a key technical level:

There can be no doubt that, absent significant outside influence, this is clearly negative in the short term for the markets.
[mmpazkzone name="in-story" network="9794" site="307044" id="137008" type="4"]
Caution is called for heading into the next few days, but some perspective, too: We're barely 4.8% below all-time highs on the S&P 500.
I'll see you next weekend... when this election is well and truly behind us.
Follow Money Morning on Facebook and Twitter.
About the Author
D.R. Barton, Jr., Technical Trading Specialist for Money Map Press, is a world-renowned authority on technical trading with 25 years of experience. He spent the first part of his career as a chemical engineer with DuPont. During this time, he researched and developed the trading secrets that led to his first successful research service. Thanks to the wealth he was able to create for himself and his followers, D.R. retired early to pursue his passion for investing and showing fellow investors how to build toward financial freedom.


