


With tariffs and trade wars, tweet wars, and turmoil in Syria, headlines have dictated some wild swings in the market lately.
Over the past two months, these news stories have kept the market in a proverbial tug-of-war that it just can't win (or lose). And while this market-versus-headlines battle has yielded incredible volatility, we're left facing a near-zero net movement for stocks.
Over the past two decades that I've been trading, I've seen just about every kind of market environment there is. Through the ups, downs, and in-betweens, I developed principles that remain true no matter what's going on. Eventually, I refined these principles into my "10 Commandments of Trading."
One of the commandments states that "Volatility is a trader's best friend." But too much of a good thing can be bad, and we're definitely seeing the effects of that now, as the market sustains no traction on either side of the trading line.
Imagine the opposing sides are two stationary objects tied together and equidistant from a central point.
However, all is not lost just yet...
You see, the charts are lining up to force the market into making a more directional move that will benefit prepared traders.
So let's take a look...
[mmpazkzone name="in-story" network="9794" site="307044" id="137008" type="4"]
The Bullish Channel vs. the Bearish Channel
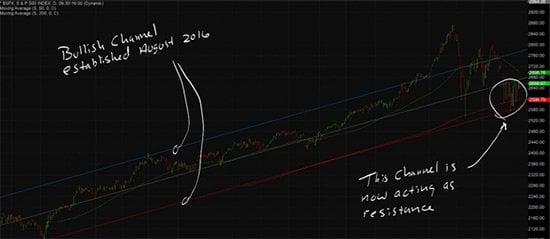
The above chart is the S&P 500, and it's nearing a tipping point for the market. The aftermath of this pivotal juncture will dictate trading moving forward, so I'm watching it closely, because this chart displays the S&P 500's year-to-date activity. Straddling the index's price ticks are regression channel analysis lines - a view of the index that breaks down the market's hurdles.
When the SPX "broke" its bullish rally channel in February, it only lasted for a few days, but the correction had a major impact on the market. Now we're dealing with an even more dramatic "break."
TOP PERFORMANCE: This man showed his paid-up subscribers 589.63% in total winning moves, closed over just five days in January. And he's offering a stunning performance guarantee for those who get in now. Click here...
Back on March 22, the SPX sliced through the bullish channel, and it has yet to reenter the trend. Consequently, the lower channel - which is acting as resistance (a sell signal) - is preventing the market from reengaging a bull market run.
Now let's take a closer look at that same chart.
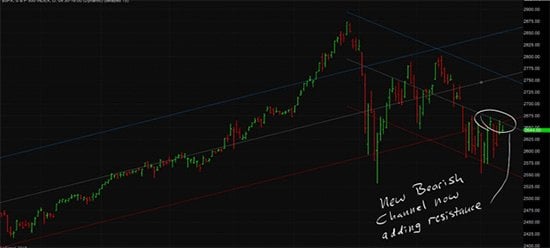
Here, we see there's a new bearish channel that initiated at the market top in late January. Take note of the resistance that this bearish trend has added to the market each time the S&P 500 has approached the channel's mean (middle gray line). This area represents a line in the sand that will serve as the tipping point for the market over the next week.
The gray line in the middle is also the convergence of the bullish and bearish channels at the 2,660 mark on the S&P 500, a price that is clearly in play today. Traders will take a failure of the broad market index to close above this mark over the next week as a clear "sell signal" that will throw the market back toward its recent lows, which is roughly 4% from current prices.
As always, the only thing that matters to us is figuring out how to trade in this environment, and with the help of my proprietary tools and years of experience, I know just how to do that...
Earnings season is kicking off next week, and traders will be focusing on these reports to determine whether they're buyers or sellers. These results will be a major determining factor for whether the S&P 500 holds at the 2,650-point level. But either way, traders need to be ready to pounce on a move, as it will be fast and aggressive - just the way we like it to make quick profits.
The new bullish and bearish channels will be duking it out, and the result of this squeeze play will be the next major catalyst for market momentum. If the bullish channel toughs it out, we'll be ready to profit from stocks and calls. But if the bearish channel wins, the sell-off will be significant, and puts will result in big gains.
As of today, a number of other indicators I track are increasing the probability of another decline and test of the double bottom formation at 2,560, which means we should be ready to take defensive positions to profit from the big move lower, as the market finally looks ready to break out of its box and into a tradable trend.
Either way, we'll be ready, because next week I'll be back to examine a few companies that I believe will provide profitable opportunities as their earnings reports approach.
This Earnings Season, Learn How You Could Turn a Small Stake into $31,000 in Just 10 Weeks
Dozens of S&P 500 companies will be making major announcements over the next few weeks that could send shockwaves throughout the market, setting off massive potential price jumps.
Knowing how to get in two full days ahead of the biggest, most promising share-price potential gains is an advantage that's never been available - until now.
Chris Johnson has developed a tool that gives 48-hour advance notice of these kinds of price eruptions - with 100% certainty.
His recommendations this year are off to an incredible start - like 153.59% on FCAU on Jan. 8...
...56.70% on ADBE on Jan. 8... 102.78% on OZRK on Jan. 11...
...and then an additional 276.47% on FCAU on Jan. 12. That's 589.63% total winning moves in just five days!
Right now, Chris is tracking dozens more opportunities that could help you trade your way to some serious cash - fast.
Go here now to see how this works...
Follow Money Morning on Facebook, Twitter, and LinkedIn.
About the Author
Chris Johnson (“CJ”), a seasoned equity and options analyst with nearly 30 years of experience, is celebrated for his quantitative expertise in quantifying investors’ sentiment to navigate Wall Street with a deeply rooted technical and contrarian trading style.