

Bulls can stop worrying about the price of gold falling anytime soon.
I've been telling you for a while that a pullback was not only normal, but healthy. Now that the data is in, I'm going to show you why.
Gold prices just notched a huge gain over a short six-month period, blasting 14% higher between August and mid-February.
That's big. And if the gold price had continued to power any higher, its correction could have been worse.

So chalk it up to normal bull action of three steps forward and one step back as gold continues to climb its golden staircase.
Although the price of gold has dropped by about $60 from its recent peak, we may have already seen the worst.
The Fed's renewed dovish stance has lower real rates back as a driving factor for higher 2019 gold prices.
And consider too that, seasonally, gold tends to bottom around mid-March then climb through until end of May.
Gold has already printed a solid bounce back to $1,310 in just the last few days, strongly suggesting its correction has run its course.
With all this in mind, there are big things ahead for the price of gold in 2019...
Why the Gold Price Is Bouncing Back
Over the past three weeks, gold has come to terms with its strong gains between August and February, with the metal's price peaking on Feb. 20 at $1,346.
From the August low of $1,175, that produced a striking gain of $171, or 14.6%.
Since that February peak, gold has dropped back by about $60 to $1,286, giving up a total of 4.5%.
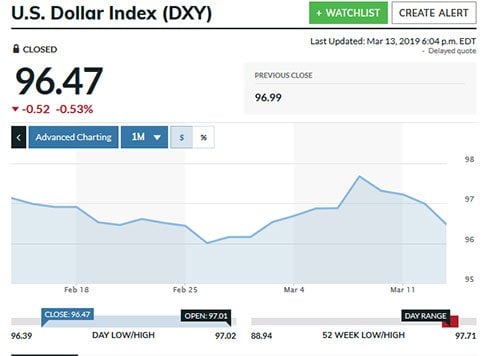
This correction in the gold price has been an almost perfect negative correlation with the U.S. Dollar Index (DXY), with about a five-day delay.
Looking at the action in the dollar, we can see that the DXY bottomed a few days after gold's February peak, and may have peaked just after gold's recent low.
But even as gold has corrected, its recent price action suggests that correction may have already hit a low.
The most recent CFTC Commitments of Traders report for the week ending March 5 shows that the net long position in gold futures dropped some 62%.
And despite such sudden, strong selling pressure, gold has held up well.
So far, gold's March 7 low has held above its Jan. 24 low, providing for a bullish higher low pattern.
It's still a bit early, but I believe we've seen the bottom of this gold correction.
What's more, if you consider the seasonal patterns of gold's behavior, we could be in a sweet spot right now.
Looking at gold's bull years since 2001, it typically bottoms in mid-March, then starts on a spring rally through until the end of May. In the chart below, you see the "high lows" circled immediately before a rally begins. This pattern should continue into 2019.
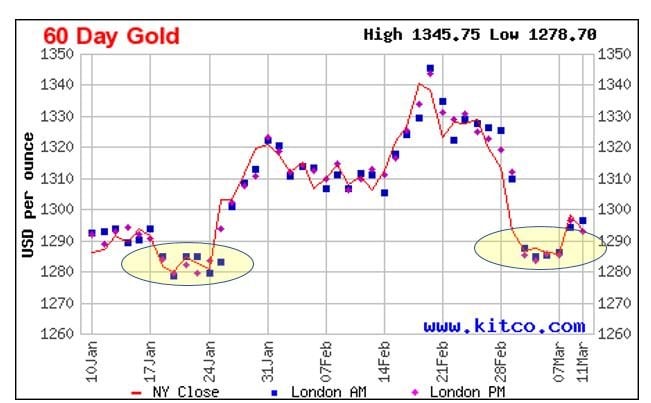
I think this potential rally has the ability to push gold above its February high near $1,340 by then. If gold can close above that level, then its previous high of $1,350 (last April) will lie within close reach.
Stronger Indicators for the Price of Gold in April
As I've said in previous updates, the dollar's direction is anything but clear at this point.
The DXY remains above its 50-day moving average, and both the relative strength index and moving average convergence divergence have been trending higher since early January.
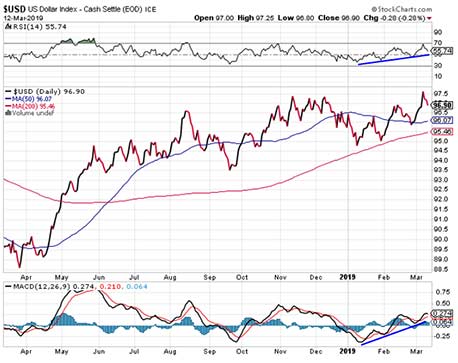
As I've noted before, this doesn't seem to have gotten in gold's way, as gold prices have continued to rally in the face of a stronger dollar. That has been a bullish omen for gold in the past.
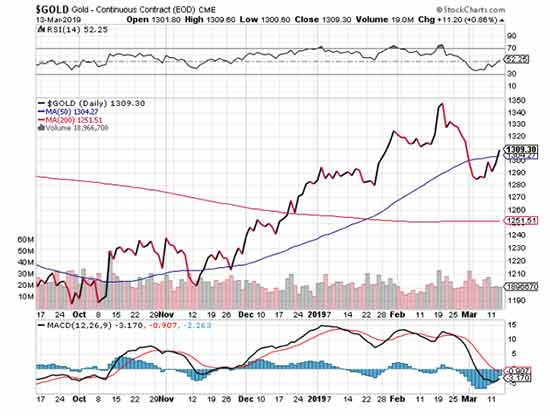
With the gold price back above its 50-day moving average, it's possible that $1,300 will now become a new support level.
If indeed the gold correction is over, it will have been relatively short, barely lasting three weeks.
Looking at gold stocks, we can see that even as gold was languishing around $1,285 between March 4 and March 7, they were attempting to push higher.
The VanEck Vectors Gold Miners ETF (NYSEArca: GDX) was trying to break higher each of those days, except for March 6, suggesting at the time that we could be witnessing a near-term bottom in gold, and that its next move would be higher.
Billions Are Now in Play: Millions of Americans could collect "Federal Rent Checks" - to learn how to claim your portion of an $11.1 billion money pool using this backdoor investment, click here now...
As it turns out, when we look at the gold stocks to gold ratio, it tells us that gold stocks held up better than gold through the correction and bounced back faster. In fact, gold stocks rose three times as much as gold since the metal started rallying late last week.
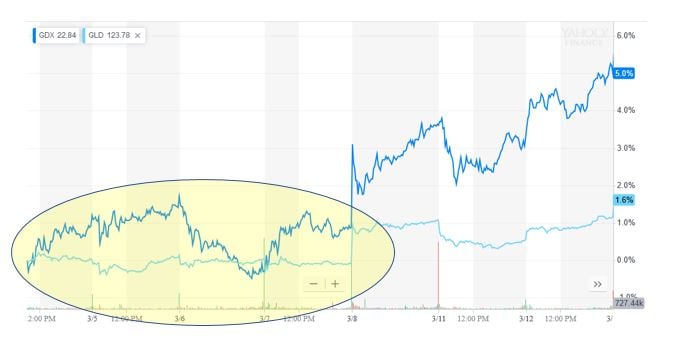
This kind of outperformance by gold equities may be foreshadowing more strength both in gold and gold stocks over the next few months.
So gold's taken a well-deserved break after rallying almost nonstop between August and February, and its technical price action is encouraging.
But on a fundamental basis, there are positive signs that gold is set to continue climbing higher this year. Here's how high the gold price is set to rise in 2019 - and a selection of the best investments for you to capitalize on it...
The Best Gold Funds for Your Money
[mmpazkzone name="in-story" network="9794" site="307044" id="137008" type="4"]
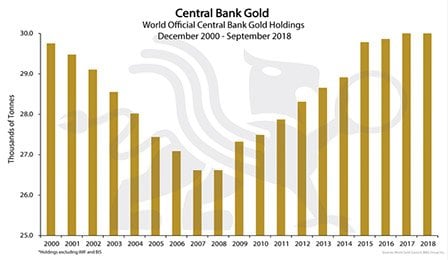
2018 was exceptional for institutional gold buying. Central banks bought more gold by volume last year than in any year since 1967.
That makes it the most in over 50 years. Thanks to increased economic and geopolitical concerns, central banks turned to gold in a big way to diversify their reserves and seek safety and liquidity.
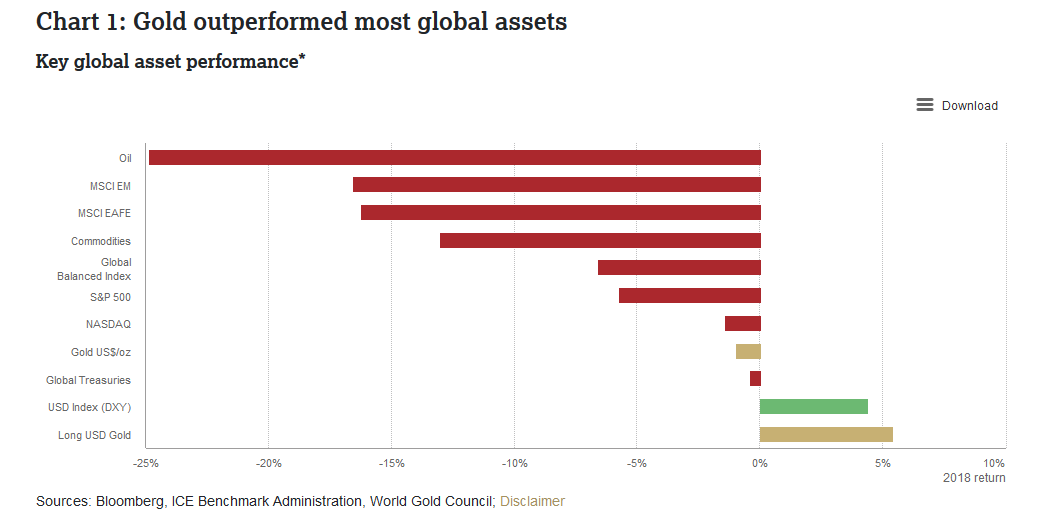
This, along with the fact that gold may have ended a long-term consolidation it started in mid-2016, may help explain why the safe haven dramatically outperformed most other major asset classes last year. The central bank has also been buying up significantly more gold each year since the 2008 financial crisis, as depicted in the chart below.
Below is one of my favorite gold charts for 2018 from the World Gold Council. You can see gold did better than not only most major stocks and global treasuries - it rose substantially in the face of a stronger U.S. dollar.
Of course, my January gold recommendations have pulled back with the sector.
The DB Gold Double Long Exchange Traded Notes (NYSEArca: DGP) are down about 16%, but as gold's bull comes roaring back, this ETF will soar. Stay long DGP and/or buy on weakness.
The VanEck Vectors Junior Gold Miners ETF (NYSEArca: GDXJ) has dialed back along with gold's consolidation/correction, and yet it's still up a respectable 7.5% since mid-January. Continue to buy on weakness.
Despite the correction gold endured starting in mid-February, it remains solidly above its 200-day moving average.
And gold priced in over 70 different national currencies, including most major ones, is either at or near all-time highs.
So, by all accounts, gold continues in a long-term uptrend, and its recent correction could well be history.
I think the precious metal is headed toward $1,350 over the next few months and remains on a solid path toward $1,400 later this year.
Claim Your Portion of This $11.1 Billion Money Pool: By following a few simple steps, one IRS directive could help set you up to receive checks of up to $1,795 every single month. Hordes of Americans have already signed their names to the distribution list - and the longer you wait, the greater your risk of missing out on this powerful investment. Click here for more details.