

The price of gold has managed to churn a few stomachs in the past month, but the data makes these lows look more like growing pains.
Gold surged through early March, from $1,285 all the way to $1,320. But toward the end of the month, it sold off pretty strongly as the U.S. dollar started a new rally.
That dragged gold prices all the way down to $1,287 in early April, before it recovered this past week to $1,307. Then, over the last couple of days, gold fell once more - this time to $1,290.
The yield curve inversion was a key factor here. On March 22, the yield on the 10-year Treasury note fell below the yield on the three-month T-bill.
Yield curve inversions have been a rather accurate predictor of recessions (which typically begin about a year later). So investors freaked out, with a bond rally pulling the 10-year yield down to 2.4% as weak global growth became a bigger concern on disappointing data.
Further boosting the dollar, the Fed FOMC meeting minutes from March released last Wednesday showed a slightly less dovish stance than expected.
And that's how we've landed at $1,290.
But while the dollar's safe-haven rally may have dented gold, its strength already appears to have been short-lived. The price of gold today hovers near its mid-March levels. And with economic uncertainties growing, it looks like it will surprise many to the upside this year.
Here's why the price of gold could rise by as much as $110 - and how you can trade it for the highest potential gain.
How Fed Decisions Affect the Price of Gold
Something very interesting has happened the last two times we had a renewed upward trend in the yield curve.
Looking at the differential between the 10-year and the two-year treasury: It dropped and then flattened out in 2000 before trending higher. In 2007, it did the same thing again.
Once the Fed began cutting rates in response, causing the yield curve to steepen once again, gold and gold stocks began trending higher months in advance.
The reason this is exciting for gold investors is that it means the market is starting to price in future rate cuts. The CME Group's FedWatch pegs the probability of a cut by October at 34%, and by December at 40%.
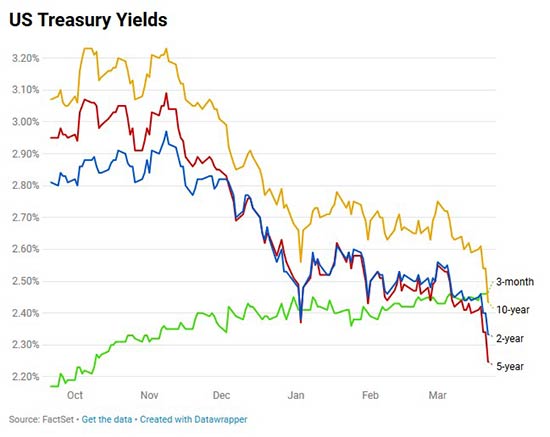
The recent decline in the two-year yield from 3% in October to 2.35% today, shown in the chart below, is a dramatic 22% fall.
This kind of drop has preceded rate cuts, and as the yield approaches 2%, a cut becomes more likely.
This scenario bodes especially well for gold stocks and gold. Given these recent yield curve developments and higher probabilities assigned to lower rates by the market, savvy investors will want to watch this sector very closely.
I believe we are in the kind of plateauing phase that typically precedes a new bull market.
Signs of a Gold Bull Market
And I think we're going to see it weigh on the dollar before long.
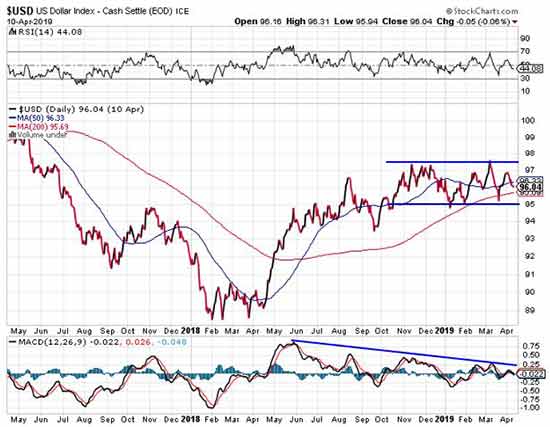
As you can see in the chart below, despite the U.S. Dollar Index (DXY) sideways range-bound movement between 95 and 97.5 since October, the moving average convergence divergence (MACD) momentum indicator has been trending downward for almost a year.
To me, concerns about a slowing global economy are going to weigh on the greenback, which for now enjoys safe-haven buying.
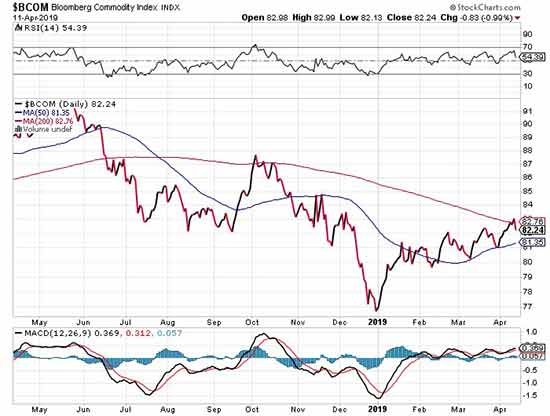
Meanwhile, inflation is creeping in. If investors don't believe it, they should consider this: The Bloomberg commodity index has just recently closed above its 200-day moving average (chart below).
It's worth noting, too, that the 50-day moving average is catching up to the 200-day, making a "golden cross" increasingly likely over the next couple of months (shown below).
Also consider that the Cleveland Fed has an alternative Consumer Price Index, the Median CPI. They feel it's a better forecaster of inflation. And it rose a stunning 2.8% in March, versus the regular CPI, which rose 1.9%.
Billions Are Now in Play: Millions of Americans could collect "Federal Rent Checks" - to learn how to claim your portion of an $11.1 billion money pool using this backdoor investment, click here now...
Even more noteworthy is that its six-month rolling average has been rising at a 3.2% annualized pace, the most since 2011. That's more than 50% above the Fed's targeted 2%.
Perhaps that's what commodities are sensing. And it's the perfect setup for precious metals.
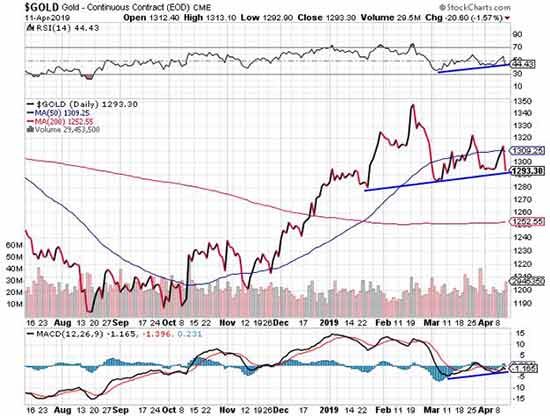
As for gold, its recent lull could be temporary.
Although gold has pulled back considerably from its February high, it has managed to establish a series of higher lows so far. At the same time, the action in both the relative strength index and MACD momentum indicators confirms a rising trend.
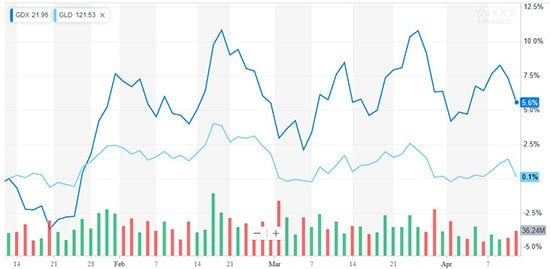
Over the last three months, gold stocks have performed well, on their own and in relation to gold prices.
As you can see below, VanEck Vectors Gold Miners ETF (NYSEArca: GDX) is up 5.6%, while gold is nearly flat over that time frame.
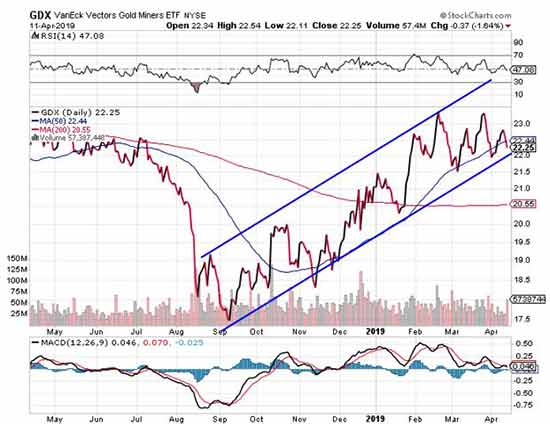
Since late January, GDX has essentially moved sideways but remains within a bullish upward trend channel.
But looking at the GDX-to-gold ratio below, we see an ongoing steady climb.
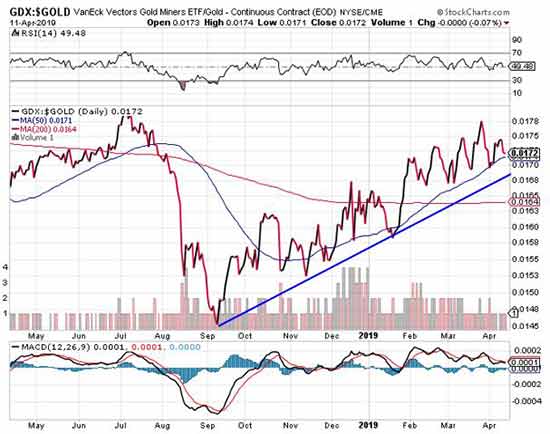
In fact, it's been grinding higher for seven months since bottoming in early September.
Yet another great leading indicator of gold's direction is platinum:
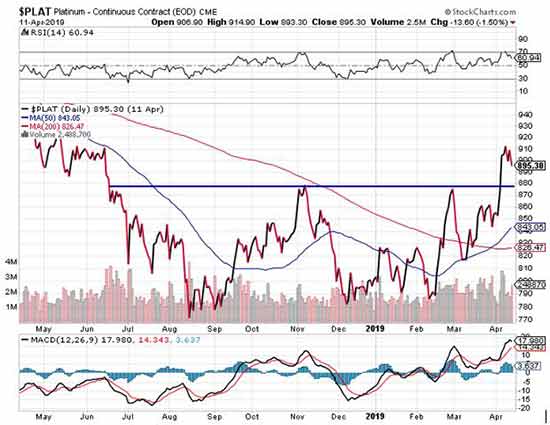
Platinum appears to be breaking out and has just established a six-month high. Currently, it's just 5.5% from a 52-week high.
With a spike in platinum, an inverted yield curve, and further global economic uncertainty down the road, well-performing gold stocks signal just the beginnings of a much stronger gold market.
In fact, this could all result in gold prices rising to $1,400 by the end of the year.
Here are two investments to maximize your gains in the lead-up to a gold bull season...
The Top Gold Investment Picks
[mmpazkzone name="in-story" network="9794" site="307044" id="137008" type="4"]
Now that you know the price of gold will almost certainly soar this year, here are a couple funds set to pop with it.
Naturally, these have struggled lately, but that just makes them better bargains right now.
The DB Gold Double Long Exchange-Traded Notes (NYSE: DGP) are down about 19%, but as gold's bull comes roaring back, this ETF will soar. Stay long DGP and/or buy on weakness.
The VanEck Vectors Junior Gold Miners ETF (NYSE: GDXJ) has retreated with gold's consolidation/correction and is now up just 1.5% since mid-January. Continue to buy on weakness.
Central banks continue to buy copious amount of gold. If you consider what's been going in bond markets, it's no surprise.
The yield curve inverted, likely foreshadowing a recession between 12 and 18 months from now. Meanwhile, the Bloomberg Barclays Global Aggregate Negative Yielding Debt Index has surpassed $10 trillion worldwide, as investors fear slowing economic growth.
China's central bank bought 11.2 metric tons in March, pulling its reserves up to 1,885 metric tons. That makes for nearly 43 metric tons purchased by China in the last four months.
Given ongoing robust buying from other nations so far, 2019 looks like it will be similar to 2018, which saw the highest levels in over 50 years.
On that note, gold should return to bull action soon.
Its obvious first target will be the $1,340 high year-to-date, set in mid-February. I think we'll see that breached over the next couple of months. From there, I think gold will challenge the crucial $1,365 high, then go on to approach $1,400 by year's end.
Claim Your Portion of This $11.1 Billion Money Pool: By following a few simple steps, one IRS directive could help set you up to receive checks of up to $1,795 every single month. Hordes of Americans have already signed their names to the distribution list - and the longer you wait, the greater your risk of missing out on this powerful investment. Click here for more details.