


Turn on CNBC, FOX Business Network, or any other financial news channel in the morning before the market opens at 9:30 a.m., and you'll be treated to a whole lineup of people predicting what the markets will do that day, or why such and such a stock will rise or fall.
You'll never really hear how or why they say what they do, though. And you'll never hear them admit when they got it wrong.
And when the Dow is jumping all over the map, plummeting 400 points one day and swinging to 600 the next, they're wrong a lot.
But today, I'm going to give you a little set of "secret weapons" the cable crowd can only dream of.
Of course, you'll be able to easily move with the markets and correctly tell what's coming, but I'm also going to show you how to make money with these moves...
[mmpazkzone name="in-story" network="9794" site="307044" id="137008" type="4"]
Here Are Your Secret Weapons
It's not tea leaves, it's not a Magic 8-Ball, and it's not a fortune teller.
The trick to reading the markets is to look at four regular, plain-old exchange-traded funds (ETFs).
READY TO GO? Anyone set to move beyond living paycheck to paycheck is invited to attend my Million-Dollar Masterclass this week. It could change your financial future forever. Learn how here...
These particular ETFs track some important benchmarks; some are obvious, and some could make you go "aha."
You don't need anything special to look them up and track them; you can use Google Finance or Yahoo! Finance or MarketWatch - whatever's easiest. And whatever you choose, it shouldn't cost you a dime if you don't want it to.
But do look at them every morning (maybe instead of cable). Monday is the start of a brand-new month - I know plenty of us will be glad to see this brutal May go into the history books - so it's the perfect time to get in the habit.
Secret Weapon No. 1: SPDR S&P 500 ETF Trust
The SPDR S&P 500 ETF Trust (NYSEArca: SPY) tracks the entire S&P 500 Index of 505 stocks (yes, there are 505 stocks on the S&P 500, thanks to class A and B shares from a few companies). It recently tested the 280-point support level. But that wasn't all; it also traded lower than that during the day.
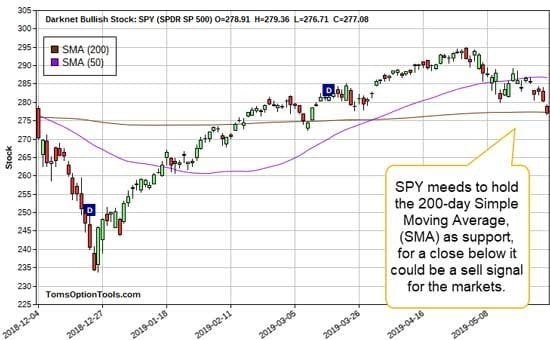
When it comes to SPY, I'll be keeping a close eye on the simple moving average (SMA) - you should, too.
The SMA is a simple technical analysis tool that gives you the average price data of a stock or ETF over a specific time period. (You can tailor it to whatever time frame you like, making it a good tool for both short-term and long-term trades.)
You can calculate it yourself by adding up the prices and dividing by the number. So to find the 200-day SMA for SPY, you'd add up the last 200 prices and divide by 200. If you were looking for, say, the 50-day SMA, you'd add up the last 50 prices and divide by 50.
Now, I'm looking for the SPY to stay above its current 200-day SMA. This would signal that the bulls are here to stay. But if we see it move below, we could be looking at the markets moving even lower.
Secret Weapon No. 2: iShares Barclays 20+ Year Treasury Bond
The iShares Barclays 20+ Year Treasury Bond (NASDAQ: TLT) tracks the overall U.S. bond market, so I use it as a good gauge for the sector. When trouble starts, it almost always starts in the credit market. And there's never been a clearer example that bonds trade inversely than if you compare the SPY chart and the TLT chart.
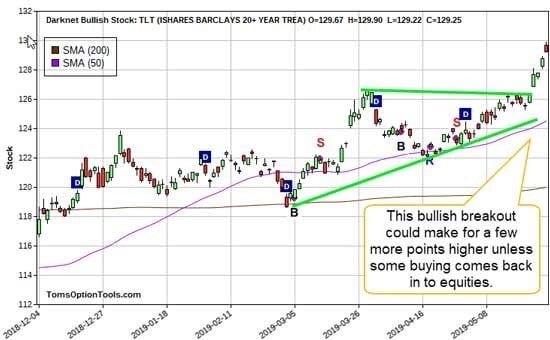
We've seen a bullish breakout for TLT over the last few weeks, as it broke above the resistance pretty soundly.
Typically, when we see a security pop like this, we can expect it to continue to trade in the direction in which it is moving. And this rings true for TLT as well - unless we see a major catalyst for buying U.S. equities.
Secret Weapon No. 3: Guggenheim CurrencyShares Euro Trust
Money makes the world go 'round, and to keep an eye on it, I track the Guggenheim CurrencyShares Euro Trust (NYSEArca: FXE), which in turn tracks the performance of the U.S. dollar and the euro - two major global reserve currencies.
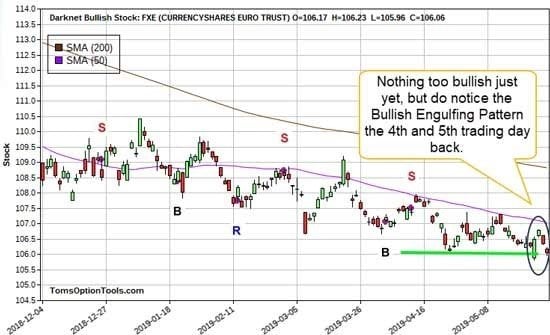
We've been watching a pattern of lower highs and lower lows forming for quite some time for this ETF - a textbook bearish pattern, in other words.
But as of this week, we've seen the pattern stop, at least for the time being. Now the highs are still getting lower, but we've seen the lows stay stagnant.
That means a bullish reversal could be heading FXE's way. This calls for keeping close tabs on this ETF.
Secret Weapon No. 4: United States Oil Fund
Oil has been a hot topic lately, although, in fairness, it usually is. Financial news networks are filled with analysts on both sides of the aisle when it comes to oil and energy. Some are saying it's a great opportunity, while others are saying its recent drop is just getting started.
NEXT SESSION IS THIS WEEK: My Million-Dollar Masterclass will give folks the chance to learn how to earn consistent income every 30 days using the trading strategies I've used to amass my own multimillion-dollar fortune. Learn how to attend here...
Oil is a great market and economic predictor; it's tied into growth, consumer spending, and stocks. When oil is up, for instance, consumer spending tends to fall; every penny increase in the price of a gallon of gas represents $1 billion not being spent on something else in the economy.
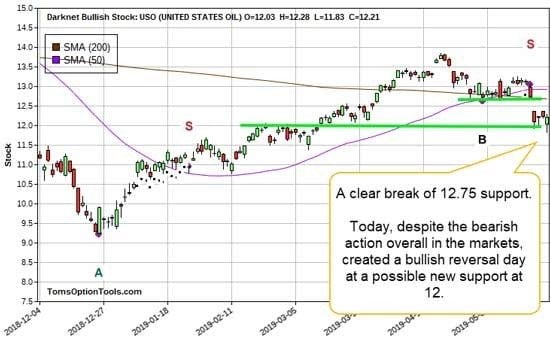
From what I've seen, United States Oil Fund LP (NYSEArca: USO), the ETF that tracks U.S. crude prices, has fallen below its previous support level and is finding new support at $12.
And like much of the market, it has been in a bearish trend since May.
Not all is lost for USO though. Despite all the bearish action happening in the U.S. equity markets, it saw a bullish reversal just the other day, on May 29.
Like with anything, this reversal could be short term - but we don't just play the market by chance. So, I'll be watching USO closely and monitoring if it holds at that $12 support level.
The takeaway from all of these "predictors" is that the market could really go either way from here; the bearish case and the bullish case are pretty well balanced at this point.
Of course, there's a way to profit from this, on any or all of these ETFs. It's called a "straddle," and it's a strategy I talked about late last month.
Briefly, what you want to do is buy an at-the-money call and an at-the-money put with the same strike prices and the same expirations on the same order - that part is critical. You can go here to learn how to do it in detail.
But when the market's moving fast... you'll want your trades to move even faster.
"Bonus" Secret Weapon: This Is the Fastest Money Out There
That's why I love using weekly options - "Weeklys" as insiders call 'em.
There's every reason to use them: They're cheap, and they can pay off in a hurry. It's easy to cut and run, too. You're in on Monday, out on Friday - if not sooner.
You can go right here to learn how to get all of my "Weeklys" research recommendations.
Join Me for My Next Million-Dollar Masterclass
Every month, I put together a class that teaches folks how they can earn consistent income every 30 days using the strategies I've used to amass my own multimillion-dollar fortune. These classes are reserved for folks ready to move beyond living paycheck to paycheck, who want the opportunity to make big, positive changes in their lives and control their own financial futures. You're invited to this upcoming session - learn how to RSVP right here!
Follow Money Morning on Facebook and Twitter.
About the Author
Tom Gentile, options trading specialist for Money Map Press, is widely known as America's No. 1 Pattern Trader thanks to his nearly 30 years of experience spotting lucrative patterns in options trading. Tom has taught over 300,000 traders his option trading secrets in a variety of settings, including seminars and workshops. He's also a bestselling author of eight books and training courses.