


Technical analysis is the study of human psychology, which is represented in the form of price action on a chart. You analyze the stock itself.
Technical analysts look for repeatable patterns and indications that can predict future price movements. Since human psychology and emotions will always be a factor in stock markets, the study of historical price movements of a stock relays the fear and greed associated with that stock.
Let's look at two technical tools that I use often - which is to say, every day the markets are open.
The first shows the movement of price in a group of stocks relative to each other. The second is a broadly watched tool that shows us both the long-term trend of a stock and important areas of support and resistance.
These two tools working together are going to reveal exactly when we should be moving on these stars of the $20 billion North American cannabis sector...
[mmpazkzone name="in-story" network="9794" site="307044" id="137008" type="4"]
Here's a Peek at My Technical Toolkit
First, I should mention that fundamental analysis, the study of the health of a company and its future business prospects, works beautifully when you combine it with technical analysis of the company's stock. It's the other component in a broad, holistic approach to securities analysis, and together with technical analysis, it's unbeatable.
Greg Miller, Director of Cannabis Investing Research, does a fantastic job each week on the fundamental analysis of marijuana companies. You can get up to speed right here if you haven't already.
Can a Single Book Make You a Millionaire? This book will show you how you can amass $1 million or more. The best part is you only have to "work" in practically effortless 10-minute increments once a week! Claim your free copy...
With that said, here's a relative performance chart of some of the more popular cannabis names. This is a busy visual, but it's useful because of all the information it packs into one chart (there are explanatory notes below):
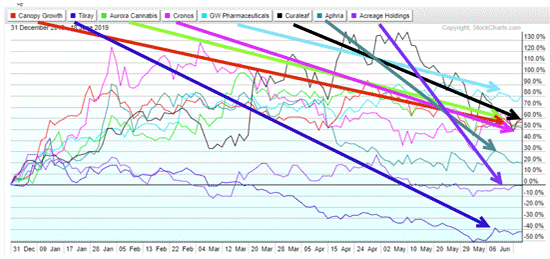
Some takeaways from this chart:
- Seven of eight of these top pot stocks are up for the year.
- Six have 20% or more gains.
- A whopping five have returns above 50% for 2019.
- Volatility continues, with wide price swings seen in almost all the stocks.
- This relatively new investing sector is outperforming almost all others.
- Wide divergence of stock performance shows the importance of stock selection in these emerging companies.
One Technical Indicator That Attracts a Lot of Eyeballs
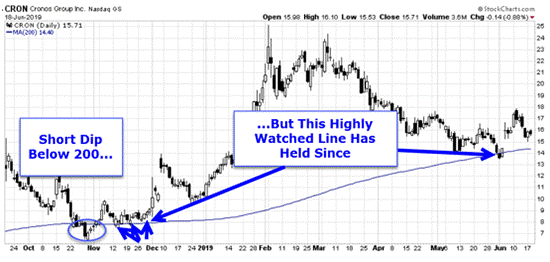
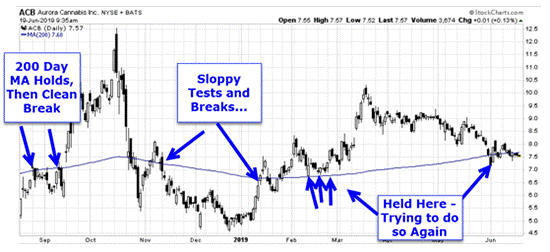
For decades, institutions and analysts have used the average price of the last 200 closes of a stock - the 200-day moving average. You'll hear and see it called "MA-200" or "200-day MA" or simply "the 200-day" a lot, but it all means the same thing. It's an indication of the long-term trend of the stock.
If a stock is trading above its 200-day MA, then it is still in a long-term uptrend. Trading below the 200-day MA signals a stock in a long-term downtrend.
THREE STOCKS: Any one of these cannabis companies could potentially deliver a 1,000% windfall. Click here to learn more...
Because this move from an uptrending stock to a downtrending one is so important, the 200-day MA then becomes a key support level for a stock that is moving down, or a key resistance level for a stock that is moving up.
And that brings me to the cannabis stocks.
The three biggest by market cap are at key technical junctures on their charts - all testing their 200-day moving averages.
Cronos Group Inc. (NASDAQ: CRON) has been a strong performer this year and has respected the 200-day moving average quite well, with a strong bounce off that well-watched line in the past week.
Aurora Cannabis Inc. (NYSE: ACB) is also in a week-long test of the 200-day MA.
The biggest of the pot stock pure plays, Canopy Growth Corp. (NYSE: CGC), has moved on both sides of the 200-day MA over the past year and is currently looking to break through the 200-day line and resume its bullish run.
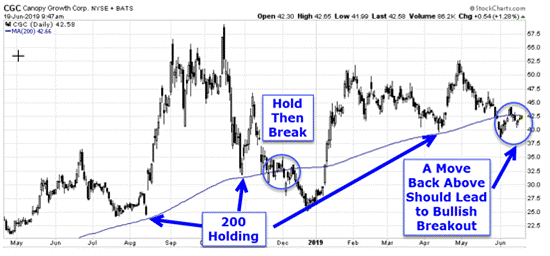
With Canopy set to announce earnings shortly after the market closes today, good news from the company could catapult the stock above this key level, receiving a slingshot effect back to the $50-plus level.
So what does this all mean for an investor? Well, with a volatile sector like cannabis stocks, adding a timing element to your buying and selling decisions is critical.
Using the tried and true formula of buying on pullbacks is a prudent way to time entries when adding a new company to your booming pot stock portfolio.
With three of the key stocks in the sector at or near important support levels, this is a good time to make those moves.
An Explosion of Cannabis IPOs Is Headed Our Way
2019 is gearing up to see a record number of high-flying cannabis IPOs hit the market - each capable of unleashing millions of dollars into the market.
It's a true investing phenomenon.
Right now, there's a real chance to get in on a once-in-a-lifetime IPO one... two... even three times a MONTH for the next year.
All you have to do is click here to learn how you can profit from the world's most exciting investment opportunity.
Follow Money Morning on Facebook and Twitter.
About the Author
D.R. Barton, Jr., Technical Trading Specialist for Money Map Press, is a world-renowned authority on technical trading with 25 years of experience. He spent the first part of his career as a chemical engineer with DuPont. During this time, he researched and developed the trading secrets that led to his first successful research service. Thanks to the wealth he was able to create for himself and his followers, D.R. retired early to pursue his passion for investing and showing fellow investors how to build toward financial freedom.