


At this rate, it's starting to look like the calendar may be your best tool to time the markets. That's right, a simple paper calendar...
January kicked off 2020 with a bang as the S&P 500 jumped more than 4% to follow up a December rally of more than 2%. The steady rally lured investors and traders into a trancelike state where all they appeared to be seeing was green. That's a dangerous state that often marks a good time to be selling stocks.
I say that because today opens a new month for stocks, a month that's less often favorable to the bulls.
Remember volatility? It's coming back this week. At least that's what the data tells me. This is good news though, as one of my "Ten Commandments of Trading" tells us that "volatility is a trader's best friend."
Looking back at the history of the CBOE S&P 500 Volatility Index ($VIX), it's pretty clear. Both the months of February and October see a 16% increase in volatility from their previous months. That tells us exactly what we already know: These are the "danger months" for the markets.
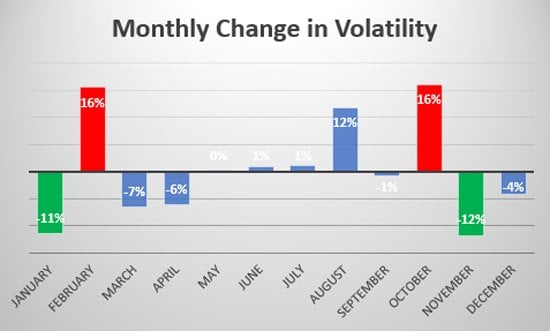
Why does February see an increase in volatility? It's actually pretty simple. The markets usually rally from November through January, putting investors into an almost euphoric state. At some point, we have to see a reality check, and what better time than when earnings season is winding down?
So far, this earnings season has helped to maintain that bullish outlook, but as I said, I think you only need the calendar to beat the market here.
Insert sidebar, right align, try to move it so the chart and the subhead aren't distorted
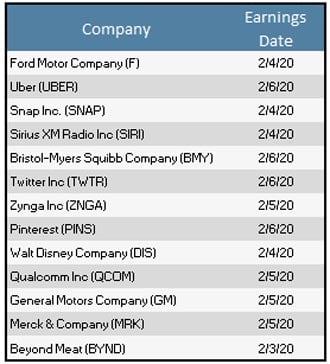
This week, we'll see 99 companies from the S&P 500 report, which is the heaviest of the reporting weeks for this quarter. The thing is that the majority of the companies reporting aren't those flashy ones that everyone likes to see drive the market higher. No, these are more of the "meat and potatoes" type of stocks that just aren't as exciting as Amazon.com Inc. (NASDAQ: AMZN), Microsoft Corp. (NASDAQ: MSFT), Tesla Inc. (NASDAQ: TSLA), and Facebook Inc. (NASDAQ: FB). Take a look at the earnings reports I'll be watching this week...
We're going to get into the less exciting earnings reports that quite frankly aren't going to excite investors. With everything else going on in the market, we're going to see traders start to sell into the recent strength.
Here's what that means for us - and how you can use it to your advantage...
Using Technicals and the Calendar to Profit in February
As I said, beating the market is as simple as using your calendar here. It's time to increase your defensive positions and take profits on those positions that have been running higher over the last four months. At the same time that you're taking those profits, you should also set target prices for reentry.
For instance, if you're selling Facebook at $205 (which isn't a bad idea), make sure that you have a targeted reentry price.
Let's look at the chart...
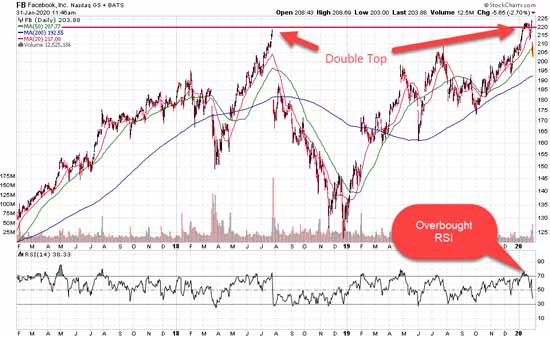
If you followed the chart, you would have been looking for a spot to sell FB shares in mid-January for two reasons.
- Shares had become extremely overbought as indicated by the readings of the stock's RSI.
- Facebook shares had hit a "Double Top" as they approached the $220 price.
These situations usually warrant some caution as the real technical traders are already eyeing an exit on any sign of weakness. In this case, the stock started to roll over followed by the sharp move lower on disappointing earnings.
Looking at the same chart, a reasonable reentry resides in the $190 to $195 zone as the stock will be oversold and at levels that have seen support and consolidations in the past. Following this simple technical navigation will avoid another 8% decline in the stock, putting profits in your pocket over the typical "buy and hold" strategy.
This Week's Bottom Line
[mmpazkzone name="in-story" network="9794" site="307044" id="137008" type="4"]
A good defense will generate profits for you during the month of February. Look for the S&P 500 to continue its descent this week to its first real technical test at 3,200. This price is where you'll find the 50-day moving average and round-numbered support.
We'll see a bounce from this level on the S&P 500, but it's likely to be short-lived as investors start to get that feeling that there's more selling on the horizon - and there is.
A good hedge against the downside risk here is to use the ProShares UltraShort S&P500 ETF (NYSEArca: SDS). This exchange-traded fund provides a return of 2% for every 1% decline in the S&P 500. It's a simple way to balance some of the risks and volatility in the market that are coming our way thanks to that simple calendar and the month of February.
Your Blueprint to Achieving Financial Freedom: America's No. 1 Pattern Trader is going live on camera to show readers how they can collect a series of take-it-to-the-bank Payday Appointments. With this fast money move, you could be making $4,238. Click here to learn more...
Follow Money Morning on Facebook and Twitter.
About the Author
Chris Johnson (“CJ”), a seasoned equity and options analyst with nearly 30 years of experience, is celebrated for his quantitative expertise in quantifying investors’ sentiment to navigate Wall Street with a deeply rooted technical and contrarian trading style.