


A lot of you might be trading more than ever before. Some even for the first time. I'm thrilled to be here to help you through it.
One of the most important trading tips to know first is that when purchasing stocks or stock options, there's one foolproof way to make sure you're getting into a winning trade every single time...
Predicting the future.
Of course, that's impossible to do with 100% accuracy - but I have the next best thing to a crystal ball. It's simple, easy to understand, and removes all the guesswork from trading.
And the "crystal ball" I use to see them is something you all can access, too...
The best way to predict stock movements is by using historic patterns and technical analysis - which go hand in hand. These technical indicators use math, time, and price to uncover stocks' patterns.
But there are two very revealing indicators I track on a stock's price chart that are the tried-and-true best ways to find lucrative trades.
When you know how to read them, it's your single best way to get a peek into the future of a stock's price and trade accordingly...[mmpazkzone name="in-story" network="9794" site="307044" id="137008" type="4"]
Support and Resistance: Two of the Most Revealing Technical Indicators
A stock chart doesn't need to be complicated. It just has to plot a stock's price over a given period of time.
I'll show you using Netflix Inc. (NASDAQ: NFLX) as an example.
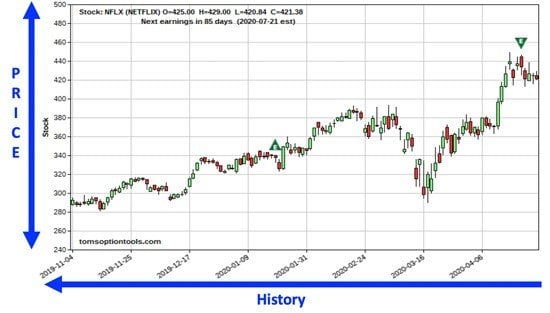
In the chart above for NFLX, each day's price movement is designated with a candlestick bar - the red and green vertical bars. We choose to use candlestick bars because they accurately illustrate the open, close, high, and low prices of the trading day.
When you see a green candlestick, it marks a bullish day when a stock went up. The lower end of the candlestick formation is where the stock opened, and the higher end is where it closed.
Bearish days, when a stock fell, are shown in red. The opening price is at the top of the candlestick, and the close is at the bottom.
The thin line that extends from the middle of the candlestick shows the intraday highs and lows - the price range the stock moved during trading that day.
Based on the chart, you can see how NFLX has traded over the past several months.
Using my interactive software, there's a function on these charts where you can tell the exact price to the penny.
I used this function to know that on Nov. 4, 2019, NFLX opened at $288, traded as high as $295.39, as low as $287.16, and closed up at $295.39 - which means that it is a green candlestick, since the stock closed higher than it opened.
Along with daily movements, you can see the highs and lows over the given period of time. Based on this chart, you can see that NFLX's overall trend is up since Nov. 4. It has traded as low as $280 and as high as $450.
Trends tend to stay in motion, so it's a good bet that NFLX will go up from here, technically speaking. But let's dive a little further to better understand NFLX's price trend and how we can make money on it...
The most powerful technical indicator you find on these stock price charts is the support and resistance.
Support is like a floor for a stock - a point that stops its downward movement. Resistance is like a ceiling - a point that stops a stock's upward movement. These levels tend to occur at round numbers - NFLX shows $10s and $20s, for example.
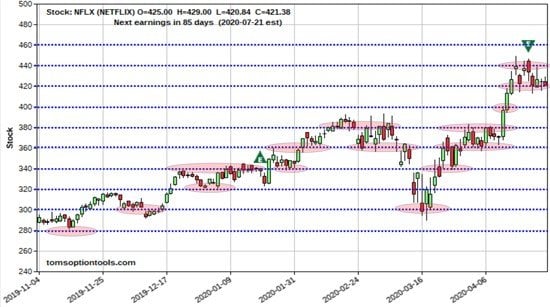
As you can see in the chart below, NFLX tends to stop at these round numbers. Once reached, NFLX either breaks through to the next level or retreats to the prior level.
The levels are measured in even numbers for two main reasons.
For one thing, it's psychological. People think in round numbers. Retail traders (you and I) use them to decide if NFLX is a bargain or if it is "overpriced." We'll say it's a steal at $300 or too pricey at $400.
More importantly, institutions that are responsible for the bulk of trading volume (the big money) use round numbers as buy and sell points. They plug them into computers to automatically trade stocks when prices reach these predetermined levels.
That's why these rounded numbers end up being such strong indicators of support and resistance. There's a lot of money pouring in to push them higher off support and a lot of selling to keep them from climbing above resistance.
And that's why they give us the next best thing to predicting the future.
To break it down even further, here's the rule of thumb:
- Go bullish if the stock closes above resistance. The price target is the next resistance level.
- Go bearish if the stock closes below support. The price target is the next support level.
Notice the number of times this simple system worked on NFLX in the chart below:

Once the support and resistance is broken, NFLX routinely moves to the next $20 level.
Currently, NFLX is resting on $420 support and has bounced off of $440 resistance. If NFLX breaks down below $420, expect it to go to $400. If it breaks above $440, expect it to go to $460.
And with this overview, we're only getting started. There are many more technical indicators to fine-tune this system and other factors you can look at in addition to support and resistance levels.
In the meantime, don't forget to check out my instant cash profit opportunity...
You see, I just dropped a brand-new way to see INSTANT CASH to the tune of $14,288 in my account, courtesy of Microsoft.
The catch? To start, I didn't buy or short Microsoft. I simply exploited a unique opportunity that exists in the markets right now. See it for yourself right here...
Follow Money Morning on Facebook and Twitter.
About the Author
Tom Gentile, options trading specialist for Money Map Press, is widely known as America's No. 1 Pattern Trader thanks to his nearly 30 years of experience spotting lucrative patterns in options trading. Tom has taught over 300,000 traders his option trading secrets in a variety of settings, including seminars and workshops. He's also a bestselling author of eight books and training courses.