


Most investors cringe when they hear the term "technical analysis."
And I get that: With a "short list" of about 75 terms, the technical-analysis realm can be a complicated one.
But it doesn't have to be.
I've been doing this for a long, long time.
So I can tell you that the real short list can be whittled down to just one single indicator.
That's right - just one.
And once you've fully grasped this one technical indicator, you can make the leap from "investing" to "trading" - where the biggest profits are attainable.
Today, I'm going to introduce you to technical trading. I'm going to tell you all about the only technical indicator you need to understand.
And I'll finish by setting you up for your first technical-analysis-driven trade...
[mmpazkzone name="in-story" network="9794" site="307044" id="137008" type="4"]
My "Technical Epiphany"
At its most basic level, technical analysis is the use of past trading patterns to make predictions about the future.
Those patterns can include prices, trading volumes, and trends. And their use can apply to any tradable asset for which historical data is available. So I'm talking stocks, bonds, options, commodities, and even the broad indexes.
What's great about these tools is that they're flexible and objective ways to "signal" strength or weakness in a security or tradable financial asset.
Once you learn how to use a few of the basic technical indicators, you'll greatly boost your odds for profit with almost any security.
My personal history with technical analysis goes back more than 25 years - to my days as a newly minted intern at Prudential Securities. Despite my heavy math background, I'd never heard of technical analysis. There were no software packages or data feeds to create technical "charts."
Indeed, most of that "charting" was done by hand.
On its face, it was boring, repetitive work. But I didn't care.
I soon realized that those technical charts were speaking to me - they told "stories." And those stories turned into predictions, which turned into profits.
I immersed myself in my new role - and watched as it turned into a lifelong passion.
I soon realized I was a devotee of the technical "school" - and started following industry "rock stars" like Ralph Acampora, Prudential's director of technical analysis.
Each and every morning, we would turn the "squawk box" on to listen. Let me clarify; I'm not talking about the television show on CNBC. The squawk box was a small wooden cube with a speaker and a volume knob on our desks that was hooked up to a network the analysts in New York could talk to the troops through every morning.
Anyway, we would listen to Ralph duke it out with fundamental analyst Larry Wachtel over the market and stocks each morning. It was amazing. Ralph was the king with his technical candor.
The edge that technical trading enjoyed over its fundamental counterpart became so clear that my personal mentor - himself an Acampora acolyte - coached me as I charted out stock prices on simple graph paper so we could create and follow our own technical indicators - and make our own "buy/sell/hold" calls.
And we developed our own clearly observable "edge."
In those days, a quarter century ago, technical analysis was a misconstrued niche - derided as "voodoo" investing and "tea-leaf reading" by naysayers and fundamental analysts alike (who were often one and the same).
Today, technical trading is in the mainstream - thanks to intense media coverage and a plethora of cheap, accessible, and easy-to-use data packages. What took me hours to update and track now takes seconds to compile.
It's no longer viewed as a voodoo science.
In today's volatile markets, it has an even greater edge over its fundamental counterpart because real-time technical signals will let you ride the market's whipsawing moves into near-term, triple-digit windfalls.
And yet, there's still a reluctance - even a fear - on the part of everyday investors, who worry that they won't be able to master the many indicators that serve as "buy" and "sell" triggers.
That brings us to my favorite technical signal - the 50-day moving average (MA).
This is the "single indicator" that I've been referring to.
By condensing technical trading down to this one indicator, we're going to greatly simplify things for you - and put you on a path to hefty trading profits.
How It Works
Here's the bottom line: The 50-day MA is the "meat and potatoes" of the technical trading world.
It's the entry-level indicator. But if you learn nothing else, you can turn this one bit of wisdom into a lifetime of trading wealth.
Best of all: It's simple to calculate.
This indicator is literally the average of a stock's closing price over the last 50 days. And it "moves" each trading day because you drop the oldest closing price in the 50-day "data set" and replace it with the newest. The 50-day MA for each trading day becomes that day's "data point."
And you plot each MA price with each successive day.
(With the wonder of today's technology, this is actually a very simple task.).
Pictured below is a three-year (daily) chart of the Standard & Poor's 500 Index with its 50-day moving average.
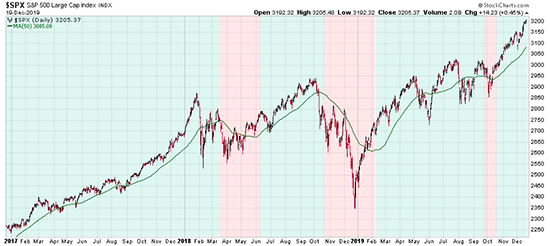
Here's the simple application. Years ago, I performed a laborious (you won't see me employing $10 words like that very often) study on the 50-day moving average of each component of the S&P 500.
Once I studied the trend line on each of the 500 stocks, I made a powerful discovery - one so important that it's become part of my core "belief system" as a trader.
"When a stock's 50-day is rising, there is a 2:1 probability that the stock will move higher. Similarly, when the 50-day is trending lower, there's a 2:1 chance the next day's price will be lower."
I grant you: It's simple rule.
But there's tremendous power in simplicity.
And this greatly simplifies technical trading, which in its most advanced form includes both art and mathematics.
A "Semi" Success Story
The simplest application of the 50-day moving average is to take your lead from its directional movement.
Here's what I mean by that.
When I've got my "quant" hat on, I'm using the slope of this trend to help determine how bullish or bearish I should be about a stock or other tradeable security. Measuring the slope of the trend as this additional bit of data determines just how bullish or bearish I should be. This is something that is incredibly useful when deciding between a buy and hold stock strategy or an option strategy.
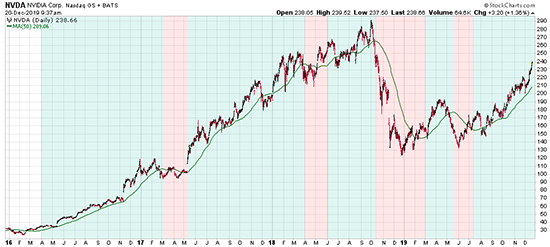
Here, let's take a look at one of the stocks that made most investors scratch their heads. Semiconductor company Nvidia Corp. (NASDAQ: NVDA) was a moon shot stock from 2016 to 2018. The fundamental analysts sat on the sidelines for most of this run because the stock was extremely overvalued. Through much of this rally, I watched the average analyst maintain a "Sell" rating on the stock because its growth was unmaintainable.
Technicians like me, we had a different view. The market was setting its value on the stock based on where the company was going, not where it had been. My favorite indicator, the 50-day, guided you to some mind-blowing profits.
Notice that the 50-day helped avoid some serious declines in Nvidia's precipitous fall in 2018 and 2019.
Now, you didn't miss the entire decline, but using the 50-day alone avoided a drop from $246 all the way down to $145 - almost half the stock's value and a move that would have wiped out almost two years' worth of gains.
The same trend line movement had you buying the stock near its 2019 bottom. And now, the most recent "signal" gave you an easy entry - buying the stock at $160 ahead of a run to $240.
That's a profit of more than 50% - about four times the market return of 13%.
Simple to track and apply, the 50-day moving average trend is considered one of my "Island Indicators." One of those indicators that I would choose to use if I were stranded on an island and could only have three.
Easy access and simple application makes it a low effort/high impact indicator that anyone can use to boost their portfolio returns above the level of most professional money managers.
Knowing this, let's put ourselves in a position to use this to make a winning trade.
Action to Take
The market is wobbling a bit again, and I still believe there's a big move to the downside headed our way.
Don't be alarmed.
Most investors view bearish market moves, corrections or sell-offs - by whatever term you want to use - as money-losing moments.
Not true.
You can actually make good money in bad markets. You can "go short," which is a topic for another time.
But you can also use sell-offs to grab shares of companies you really want to own - at bargain price levels that you choose.
We recently outlined a similar strategy with Zoom Video Communications Inc. (NASDAQ: ZM) - the videoconferencing player that's experienced torrid growth amid the coronavirus pandemic.
We're going to do something somewhat similar here.
This market will tip over. And when it does, we'll see momentum build to the downside again.
That means almost everything will start to break through their respective 50-day moving averages.
Knowing that, we're going to look to buy a strong stock during the next round of selling. And we're going to use our "single indicator" to help target the right price to do so.
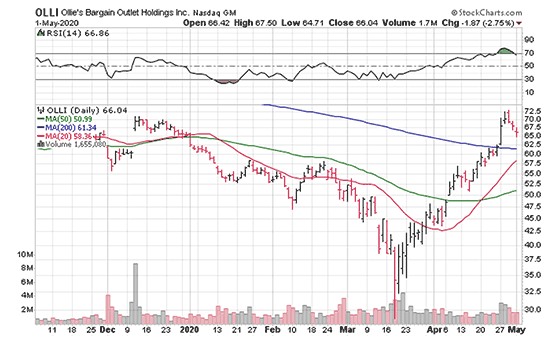
The stock I'm interested in is Ollie's Bargain Outlet Holdings Inc. (NASDAQ: OLLI). That's going to be our bullish recommendation.
The Harrisburg, Pa.-based retailer is an outperformer because of its strategy: It buys brand-name "closeouts" from other big retailers - and then sells that stuff at prices that are 70% or more below what they'd sell for in regular retail stores.
The timing couldn't be better.
When the U.S. economy does begin to reopen, I believe one of the first things we'll see is large retailers clearing away inventory that's been sitting for months upon months.
Ollie's will gobble that up and make a mint from it - while other retailers stock up on "new" inventory.
Given the strong story on the discounter side of the retail market, Ollie's shares have been in a bullish trend. And with America's economy slowing and millions losing their jobs, we'll see more shoppers hitting the discounters - looking to save increasingly scarce discretionary dollars.
OLLI hit an overbought reading last week, which has the stock moving lower as those that have been in the stock for the 100% gain since March (that's right, the stock has doubled since March). Ollie's stock offers something that many others don't - a 50-day moving average that is now in a bullish trend. This means that the outlook over the next four to six months is positive.
What's more, OLLI shares are likely to see support at that same moving average, currently residing at $50 and rising.
Given this, the bulls can afford to wait a week or maybe two, but should target buying Ollie's shares at a price of $50.
Think about it: You're setting yourself up to buy the stock at a 23% discount from its current price - while everyone else is either losing money because they're frozen in the headlights, or are panic-selling everything in sight.
There's an old adage that I like a great deal - one that says "Luck favors the well-prepared trader."
Using technical analysis and the "one indicator" - the 50-day moving average - you'll be as well-prepared as any trader out there.
And as wealthy.
We'll continue to bring you analyses, trading tips and strategies, and profitable opportunities.
And in the meantime, be sure to check out this opportunity presented by my colleague Tom Gentile...
You see, he's been tracking this little-known market for the last 22 months - and we've never seen anything like it.
There are hundreds of these opportunities being traded every day. And absolutely anyone can capitalize on them.
So today, we're going to blow the lid off this thing - and show you how you can pocket gains like 473%, 631%, even 933%...
Follow Money Morning on Facebook and Twitter.
About the Author
Chris Johnson (“CJ”), a seasoned equity and options analyst with nearly 30 years of experience, is celebrated for his quantitative expertise in quantifying investors’ sentiment to navigate Wall Street with a deeply rooted technical and contrarian trading style.