


It feels like 10 years ago, but it's really only been about seven weeks since that fateful April 20, when a COVID-19-driven collapse in demand pummeled West Texas Intermediate crude oil futures. Prices hit the floor, fell through it, and landed in negative territory at -$37.63 a barrel.
In those seven weeks, WTI has rocketed almost 200%. The S&P Oil & Gas Exploration and Production Select Industry Index has risen nearly 70%, though it's still down more than 24% for the year.
Over the past few days, though, oil benchmarks have been creeping 2% and 3% lower, which in my experience is a big, neon sign saying "Selling Ahead." And several marquee energy stocks like Occidental Petroleum Corp. (NYSE: OXY) and Halliburton Co. (NYSE: HAL) are also flashing sell-off warnings.
This reminds me of the old Road Runner and Wile E. Coyote Looney Tunes cartoons - remember them? One of the (many) cheesy running gags had Wile chasing Road Runner only to overshoot him at a cliff. Wile would hang there in midair for a second, have a "Maalox moment," and then drop.
That's not all that different than what's happening in crude right now. Both the commodity and most of its associated stocks entered what market technicians like me call "overbought" territory. Now they're dropping like rocks. Investors are starting to figure out if they're in over their heads.
How do I know? The answer is worth exploring because it can make you a sharper trader. There's one simple, small number you can look at in any stock chart that can tell you instantly how to play it.
I'll get into that briefly, and then I'll tell you how to play the oil patch's precarious "Wile E. Coyote" situation...
How to Instantly Tell Overbought from Oversold
This is ridiculously easy once you know what to look for; it's one basic technical indicator.
It's called the relative strength index (RSI). The RSI is a momentum indicator that analysts have used for more than 40 years to measure the size, or magnitude, of recent changes in a stock's price. As you'll see in a second, the RSI looks like an oscillator - a line graph that moves between an upper boundary at 100 and a lower boundary at 0.
Here's the cool part.
If the reading is below 30, chances are good that the stock you're looking at is oversold or undervalued; it could be time to grab shares at a bargain. On the other hand, if the RSI is reading above 70, bandwagoning is in effect, and the stock is probably overbought. Time to tighten up those trailing stops I mentioned, or maybe even start looking for the exits.
Take a look at the charts on OXY and HAL both, and keep in mind that on Tuesday, both were above 70.
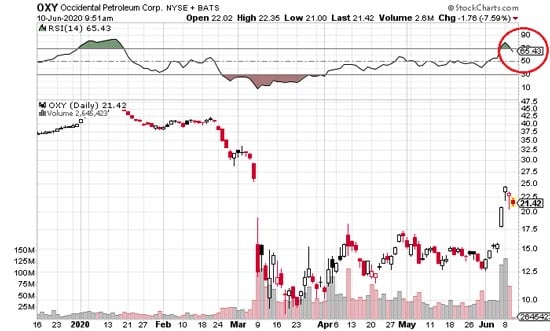
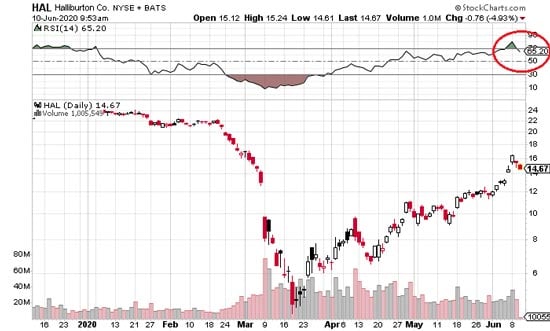
These charts don't look like the ones I usually use, with the different simple moving averages. To make this really simple, the charts are stripped of everything but price, volume, and RSI. The reading runs across the top; it looks like a cross section of a mountain range. And the RSI itself is circled in a big bold, red oval.
OXY and HAL became overbought, and now they're paying the price, falling fast. Look at the way the RSI built up and then began to collapse in the shaded triangle shape.
The why of crude's overbought condition doesn't matter as much as the fact of its overbought condition, but there's really no mystery there, either. Oil traders and investors have gotten caught up in the "Irrationality Rally," too, just the same as everyone else in nearly every sector that's been rallying like crazy the past several weeks. They're starting to wake up to that fact.
Here's what to do about it before everyone opens their eyes...
[mmpazkzone name="in-story" network="9794" site="307044" id="137008" type="4"]
How to Play Crude's Current "Looney Tunes" Moment
First things first: Defend yourself. If you've got crude positions in ETFs like the United States Oil Fund LP (NYSEArca: USO) or the United States Brent Oil Fund LP (NYSEArca: BNO), which track crude benchmarks traded in New York and London, respectively, revisit those trailing stops and tighten them up, even to 3% or 5%. The selling storm will hit - it could even be significant - but it'll pass, and you want to make sure you keep your profits out of the wind.
If you've got stocks in oil companies or oil-adjacent sectors, do the same.
If you're feeling really risk-averse (and I wouldn't blame you for a second if you are), go ahead and sell. Lowball the market by setting up buy-limit orders to get back in at low prices. You can do the same if you don't want to sell but you feel like adding to your position on the ride down.
Hedge with inverse oil ETFs that pay you the inverse of oil's slide. These can be risky and volatile, so small positions with tight mental stops - in case the market goes against you - are the way to go here.
An easy hedge to put on is the ProShares UltraShort Bloomberg Crude Oil ETF (NYSEArca: SCO). That's not terribly expensive insurance at the moment, and it uses leverage to get you twice the daily drop in the Dow Jones UBS Crude Oil Sub-Index.
For an inexpensive way to profit, look at puts on the BNO ETF I mentioned above. My target on that is $9, which would be around a 15% drawdown from current levels. I think the BNO July 17, 2020 $10 put (BNO200717P00010000) is primed for a nice payoff in the next two weeks.
As far as the physical commodities the BNO and USO ETFs track, I'm expecting Brent to retrace its path back down to $35 and WTI could very well revisit $32.50 in short order.
The bottom line is that oil is overextended, caught up in what legendary Fed Chair Alan Greenspan called "irrational exuberance." It's going to catch plenty of investors and traders unprepared, but you don't have to run with that crowd.
Now that you know the score, I'd like to invite you to click here and learn how to get access to my Night Trader live trading room. You can get the chance to jump in, look over my shoulder, and see how I recommend my "Morning Trade," and be among the first to hear about what I think are the possible top profit opportunities of the day. It's your shot to capture 52%... 78%... even 108% in a matter of days.
Follow Money Morning on Facebook and Twitter.
About the Author
Chris Johnson (“CJ”), a seasoned equity and options analyst with nearly 30 years of experience, is celebrated for his quantitative expertise in quantifying investors’ sentiment to navigate Wall Street with a deeply rooted technical and contrarian trading style.