


In the sometimes-complicated world of technical analysis, it often pays to just keep things simple.
Part of my daily analysis of the market includes checking the list of companies that are making technical moves as their patterns grow stronger. The simplest way to do this is to scan my database for the best stocks to trade and find those with a "Silver Cross" pattern.

A silver cross happens when a stock's 20-day moving average crosses above its 50-day moving average. That's similar to another indicator you may have heard of, the Golden Crosses. That's when a stock's 50-day moving average moves above its 200-day moving average.
In both cases, a shorter-term trend line crossing above a longer-term trend line, signifying a transition from either a correction or consolidation into an uptrend. And it's typically a bullish catalyst for the stock.
My models scan for gold and silver crosses each day to find stocks moving into Wall Street's "fast lane." But we're more interested in silver crosses because they're more likely to develop into better, faster gains.
While the "cross" puts a stock on my radar, I dig in further to confirm the bullish signal.
Here are the simple rules I follow to make sure I've found a great trading opportunity...
Stock Trading Rule No. 1: Flat 200-Day, Walk Away
A silver cross doesn't always mean a stock is about to head higher. It could be stuck in a flat trading range.
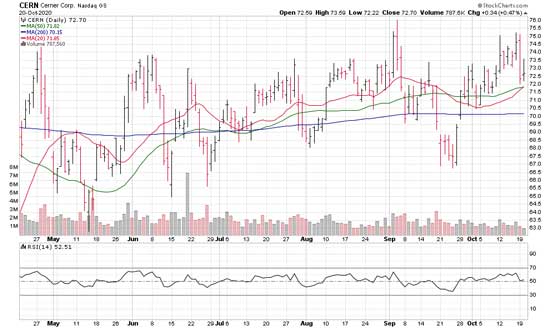
Look at the chart for Cerner Corp. (NASDAQ: CERN) below. The trading range is clear: The two trend lines are relatively flat and directionless. This makes it easier for the trend lines to make "crosses" more often, resulting in almost worthless signals.
Bottom line, I'm not likely to see a fast and aggressive move from the stock, so I'm taking a pass.
Stock Trading Rule, No. 2: Rising Trends Are a Bullish Trader's Friend
When both the 20- and 50-day trend lines are rising, it's a cue that you're on to something.
Following one of my Ten Commandments of Trading, the trend is your friend. This is almost always represented by a rising 50-day moving average. On average, a stock is likely to close higher the next day two out of three times when the 50-day is rising. That's usually a trend worth trading.
The fact that the 20-day is making a cross above the bullish 50-day tells you that a stock is making a breakout into another trading trend higher. These are usually followed by a bullish breakout.
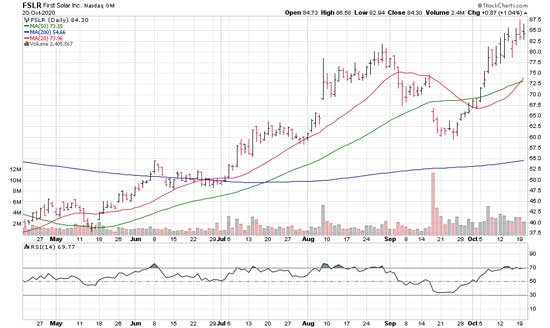
The chart of First Solar (NASDAQ: FSLR) is a good example.
Bottom line: These are the stocks that traders want to take a closer look at.
Now that we've gotten the rules out of the way, let's look at three stocks getting ready to break higher...
3 of the Best Stocks to Trade Right Now
Let's hit First Solar, since we've already looked at the chart.
This "alternative" stock - that's what I refer to them as during my daily livestream sessions with my followers - is setting up for a move toward a target price of $100.
The stock has been on a tear for the last year as shares are trading 53% higher year to date compared to the market's return of 6.6%.
The stock is breaking out of a five-year trading range (that's right, FIVE YEARS) that has bound it between $30 and $80. Now, you can make money in that range, but the breakout - and rising volume - is indicating that this run is ready to go to the next level.
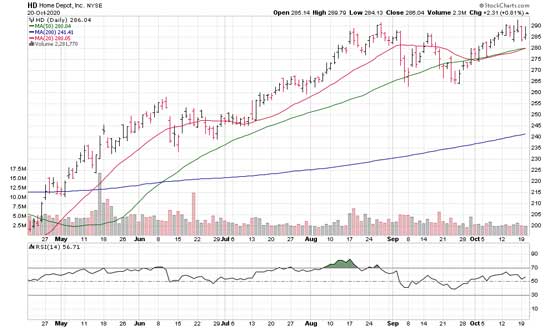
Next, housing is strong, and that's good news for Home Depot Inc. (NYSE: HD).
The stock has been in a range for the last two months as it fought with breaking through $300. There's momentum building in the trend though as we're ready to get another round of fiscal stimulus.
Home Depot has doubled the year-to-date for the housing sector and is working on tripling the returns for the retail sector. What I'm telling you is that this is one of the "Best in Breed" stocks in both groups.
Watch for a break of $300 to target another 15%-20% jump in HD share prices
But my last stock to trade is about to pop 20% higher in a hurry...[mmpazkzone name="in-story" network="9794" site="307044" id="137008" type="4"]
Yum! Brands Inc. (NYSE: YUM) has been on the rise as it has become clearer that the pandemic is not likely to close fast food chains.
Shares are trying to bust through the century mark ($100), a move that is likely to gain more traction for the stock.
The fact that the restaurants under its flag are fast food chains is likely to garner even more momentum as we head into the colder months and local sit-down dining options may be constrained by the pandemic.
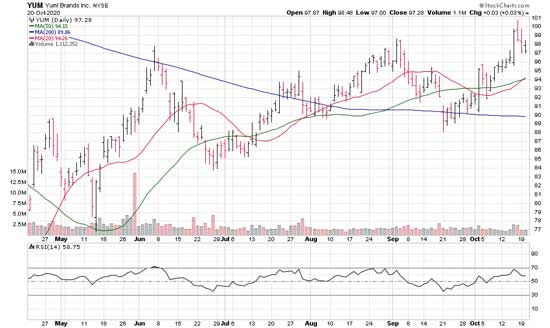
A final kicker, the move above $100 will indicate that the stock has broken into a long-term bull market trend as this price is also the site of the 20-month moving average.
Target a move to $120, fast!
Millennial Millionaire's One-of-a-Kind Trading System
It's been generating money hand over fist since the recession of 2008... and now, he's finally sharing the secret!
Investors in today's economic climate need every advantage they can get, and I don't think I've ever seen a strategy more powerful than this.
Click here for the full story and the next three plays he has his eye on.
Follow Money Morning on Facebook and Twitter.
About the Author
Chris Johnson (“CJ”), a seasoned equity and options analyst with nearly 30 years of experience, is celebrated for his quantitative expertise in quantifying investors’ sentiment to navigate Wall Street with a deeply rooted technical and contrarian trading style.