


So... it's been a heck of a week, right? And I'm not necessarily talking about what happened in D.C.
Bitcoin just went through what might be its most dramatic week in years, maybe the most dramatic ever.
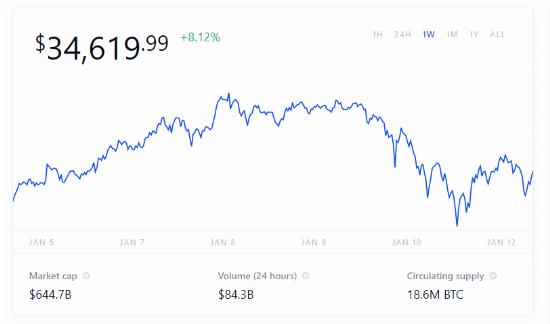
Now, Bitcoin is famous for volatility and drama, but the past couple of days have seen volatility on a whole other level.
In less than seven days, we've seen the digital currency move from the low $30,000s to come within striking distance of $42,000... and back down to the low $30,000s before stabilizing in the $34,000 range. Talk about a roller coaster.
That leaves us with two big questions...
- What's causing these violent price movements?
- Where could Bitcoin go from here?
Knowing the answers to those questions is the key to cashing in right now, and as I'll show you in a second, it's all here in these charts. Let's jump in...
Here's What's Causing the Volatility Spikes
 I've been successfully trading cryptos for years now, and my experience tells me there are three forces driving this volatility, one of which is relatively new - I'll show you in a second.
The first driver? Economics 101. Simple supply and demand. Bitcoin is hardwired to be finite; it's in the original source code. There will only ever be 21 million Bitcoins. That's it - no ifs ands, or buts.
As of today, there are around 18.6 million coins circulating, and the "reward" Bitcoin miners get drops by half on a schedule.
MY PREDICTION: I'm revising my 2021 Bitcoin target upward, but my six-digit nine-year forecast hasn't changed yet - here's what you need to know...
But like we talked about last week, institutions are beginning to move into Bitcoin in a major way. Not only have payment mega-firms like PayPal Holdings Inc. (NASDAQ: PYPL) and Square Inc. (NYSE: SQ) embraced it, but institutional investors are beginning to sit up, take notice, and jump in. Just last week, I showed you a chart that showed a record number of bitcoins leaving wallets during the first weekend of the year - a sure sign that institutional investors - big money - is moving in. With every new user that comes on board, that built-in scarcity gets sharper and sharper. I've said that Bitcoin's passed a "tipping point," in terms of widespread adoption, and it looks like I'm right on the money.
We're also beginning to see investors use digital assets as a kind of safe harbor. These kinds of assets have already made investors 244,933 times more than gold, but coins are beginning to behave more like gold as a store of value. I don't think anything will every fully replace the yellow stuff, but over time - especially now that Bitcoin has hit "critical mass" - sentiment toward Bitcoin, Ethereum, Litecoin, and the like as safe harbor investments will grow. But all this is taking place against a backdrop of unprecedented uncertainty and unrest, and all the while, the U.S. dollar is in free fall as the Fed tries to shore up the economy. These are all classic reasons for a flight to safety.
I'M WATCHING: I'm not sure anyone else is paying attention to this crypto phenomenon, but I sure am. I've discovered double-, even triple-digit moves in a matter of days nearly every time Bitcoin jumps. Take a look at this...
And then we've got some old-fashioned FOMO in play right now - the "fear of missing out." Just like in 2017, the retail-investing public has piled into the digital currency. Since Christmas, "Bitcoin" and "BTC" have been fixtures in the top 10 Google searches. Speaking of 2017, I don't want to give the impression that we're in a similar situation, where Bitcoin will just crash - and stay crashed.
The fact that we're seeing the price rally strongly off lows with strong volume is proof that this time is different.
Here Are the Important Bitcoin Support Levels
I'll share a screen grab from one of my proprietary cryptocurrency analysis tools - one of the same ones I use when I'm researching a recommendation for my Microcurrency Trader readers.
I decided to take a really long view in this chart, because, frankly, I think the pattern we've been seeing lately has really been in continuation since Labor Day; looking at a three-month chart just won't tell us much.
So I backed it up to June, when Bitcoin was trading below 10,000 and moving sideways.

These blue lines you can see plugged in here are Fibonacci retracement levels. (If you're not up to speed on the "Fibos," you can learn all about those right here.) You can use the Fibonaccis with just about everything you can trade - stocks, currencies, oil, coffee - name it. They're perfect for working out intermediate- and long-term support levels and buying opportunities - places the prices are likely to stop on the way down.
Just a few days ago, we hit that all-time high of $40,000 - that's our zero point. I'm rounding here, but if we retrace 38% from that, we'll see Bitcoin at around $28,000, at 50% retracement, we'd see $24,000, and at 61%, we'd see Bitcoin at $21,000.
Here Are the Upper and Lower Bitcoin Targets
Of all the lines, the 38% and 50% retracements are the most important. Because Bitcoin is so volatile right now, I think the 50% retracement level is the most important here - it's where I think support is going to be strong, maybe even unbreakable.
Now, to be clear, I'm not saying Bitcoin is definitely going down to $24,000 and some change; not at all. What I'm saying is I don't think it will go lower than that.
Just as important, I think the near-term ceiling, above which we'll need new charts, now could be as high as $65,000.
This is a really exciting time to be in crypto, and there's a lot more to it than Bitcoin. Aside from Bitcoin, Ethereum, and Litecoin, all of which I research regularly for Microcurrency Trader readers, there are dozens of smaller coins. Some might not go anywhere, but some can sometimes move 142% in 12 days, 330% in 82 days, or 273% in 14 days. One of them even jumped 1,900% in just 62 days. You can click right here to take a look at some details on this chart...
Follow Money Morning on Facebook and Twitter.
About the Author
Tom Gentile, options trading specialist for Money Map Press, is widely known as America's No. 1 Pattern Trader thanks to his nearly 30 years of experience spotting lucrative patterns in options trading. Tom has taught over 300,000 traders his option trading secrets in a variety of settings, including seminars and workshops. He's also a bestselling author of eight books and training courses.