


A bull market run, whether you're talking about a stock, a sector, or the entire market, is a powerful thing to behold - and I've been through plenty in my career.
There's cautious buying at the start, testing the waters... then a breakout... a top-feeding frenzy explodes as the financial media goes bananas... and, best of all, profits stack up fast.
It's incredible; there's nothing quite like it.
But I'm here to tell you, it's even better when you're in it from the start. Nobody wants to hang back on the sidelines while stocks go ballistic, but if you wait too long, it might be too late. Or worse, you could end up losing money.
Of course, everyone wants to run the distance with the bulls. That can be easier said than done; a lot of regular investors don't have the data or systems to give them that all-important "Go!" signal.
Well I do, and today I'm going to share it with you. It's easy to spot, easy to use, and it'll help you profit from bullish runs from start to finish - that's performance a lot of investors can only dream about...
Use This... and There's No Mistaking a Bullish Move
These runs higher have a distinctive, easy-to-identify signature. It's as easy to spot as the Washington Monument once you know what you're looking for.
Those familiar with technical analysis - even at the beginner's level - have probably heard of the golden cross. Basically, a golden cross occurs when a stock's 50-day moving average crosses above its 200-day moving average.
"HYPERDRIVE" EVENT: A projected $353 billion capital wave headed toward five specific companies could hit in the next 18 months. The shift could make a fortune over that time frame. Details...
When both trend lines start trending higher after this pattern occurs, it's a sure sign of growing long-term momentum.
My studies show that golden crosses are good for long-term investors that are looking to buy and hold for periods of six months or longer.
But there's something more effective for shorter-term traders - something that identifies a breakout trend.
It's called the silver cross.
Like the golden cross, the silver cross occurs at the crossing of two trend lines. In this case, the 20-day moving average is crossing above the 50-day. The shorter-term trend lines (20- and 50-day) mean that this cross is more sensitive to shorter-term trend changes, which allows us to identify a short-term trend poised to grow stronger.
Using faster-moving trend lines can get you into trends at the exact right time, and that's early, before the crowd. Beat the crowd to an early trend, and you'll almost always boost your profits.
That's the theory - now let's get to the really good stuff... some stocks to play that are experiencing a silver cross event.
Here Are Some Choice Bullish Trading Opportunities
The table below lists the silver cross stocks from a recent database run. The results fall across several sectors and price ranges. Remember: We're only interested data and trends here, not the market's noise.
The opportunity is in the data.
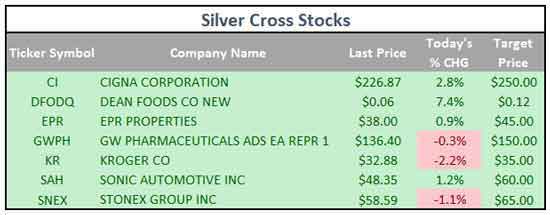
Of these seven stocks, two are worth a hard look...
EPR Properties (NYSE: EPR) is a real estate investment trust (REIT) based in Kansas City, Mo., that invests in amusement parks, theaters, and ski resorts. Its ski resorts are smaller and further east compared to some of the larger resorts that I like to frequent through the winter. As a result, they've had a rough year, but the trend in the stock is improving as the vaccine begins to make its way into our arms.
EXTRA: The five best stocks to buy for 2021 (and dozens of popular stocks to avoid like the plague). Watch now...
EPR's chart just saw a silver cross as the stock makes its way back above the $40 level. This price has been a site of resistance for the shares for the last three months as headlines continue to slow entertainment stocks, but the data is telling us that the trend is setting up for a breakout.
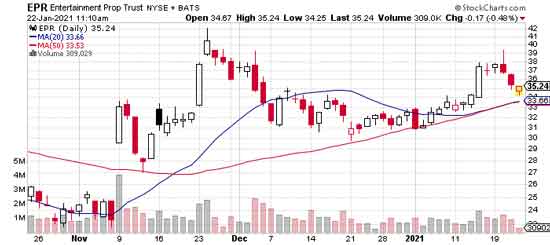
My chart read on EPR sets a target price of $45, a 28% jump from current prices. We should see that move materialize over the next four to six weeks as the company's earnings date approaches on Feb. 24.
Look for a move above $40 to get more technical traders in the buying mood, which will help fuel the additional move to $45.
Healthcare is anything but sexy, but the chart for Cigna Corp. (NYSE: CI) is getting attractive.
The new administration is likely to bring some clarity to the healthcare situation in the United States, which will give a fundamental lift to companies like Cigna. In addition, we've seen cost-cutting efforts combine with the pandemic - that's right, the pandemic has helped some healthcare stocks as claims have been lower - to put these companies in bullish trends.
CI shares jumped out of bed and started running the day after the election in November. There's your hint that the healthcare companies have an interest in the new administration.
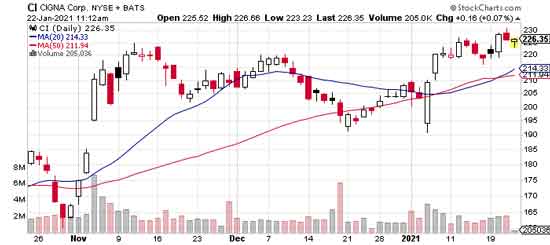
We saw a silver cross of CI shares on Oct. 23, 2020. Thirteen days later, the stock was trading 20% higher. That's the perfect example of the power of watching this trading pattern.
Shares became overbought (crowded) in Late November and December, which is why we saw the stock dip back to $200.
Now, the stock is flashing another silver cross, and my chart read is targeting a move to $250 - an easy 10% rally.
That's how easy it can be to identify stocks that can be this close to breaking out, but it's not the only way. My friend and Money Map colleague, Shah Gilani, is currently clocking a $353 billion "Hyperdrive" capital wave that seems headed for five specific stocks - you can learn all about that right here. The potential could be extreme.
Follow Money Morning on Facebook and Twitter.
About the Author
Chris Johnson (“CJ”), a seasoned equity and options analyst with nearly 30 years of experience, is celebrated for his quantitative expertise in quantifying investors’ sentiment to navigate Wall Street with a deeply rooted technical and contrarian trading style.