


This week, earnings season finally started in earnest with about 60 S&P 500 companies announcing the results of their 2017 fourth quarters. Many of the companies that reported this week are large banks, so you'll likely be familiar with many of them.
For instance, BB&T Corp. (NYSE: BBT), M&T Bank Corp. (NYSE: MTB), and Morgan Stanley (NYSE: MS) all reported their earnings yesterday morning before the market opened. And all three bested their respective analyst estimates. There were many other financial institutions that also exceeded analyst expectations on Thursday morning - so this is a great sign of economic stability and growth in the market right now. But it's only one sign...
Today there are other institutions you're likely familiar with, such as Citizens Financial Group Inc. (NYSE: CFG), SunTrust Banks Inc. (NYSE: STI), and Synchrony Financial (NYSE: SYF), among others. It will be interesting to see how they fare.
As we move forward, stronger economic growth, less government regulation, and quicker lending should favor the banks. But those are all things that we've been hearing about for a while now, and none of them have, to this point, come to fruition.
And if we dig even deeper into the vaults of these banks' economic standings, we'll find some less-than-stellar news in their net interest margins, lending, and trading activity.
Luckily, that just opens the door for even bigger profit opportunities - like this one...
Good or Bad, We Can Turn Major Profits on These Earnings Reports
Despite the lagging technical data when we dig into the financial sector, I believe banks will be able to get past that this earnings reporting season as they continue to beat expectations.
Also on the industry's side are the corporate tax rate's decrease from 35% to 21% and the potential interest rate hikes due from the Fed this year.
The Fed is forecasting at least three rate hikes this coming year, which should be favorable for the banks as the amount of interest they can charge on their loans would rise higher and should translate to their bottom lines.
Should this good news come to fruition, investor confidence will continue to rise. With more confidence in the banking sector, there should be increased buying of bank stocks, which would result in higher share prices.
That's good for investors, of course - the kind of people who want to put large portions of their capital into whole shares of companies and wait for incremental gains over long periods of time. All they have to do is work with their financial advisors to determine which stocks to buy, then wait.
As I said, a positive outlook for banks is good for investors, but we're going about things differently, and the news on banks - good or bad - will be way better for us...
You see, we'll be opening positions in these banks with options. And that's going to lead to even more profits in a much shorter time and with much less risk.
Since trading around earnings reports can be volatile, we need to protect ourselves and our capital with very specific options trading strategies. One such strategy is the straddle, which I wrote about earlier this week.
The straddle is a great way to make a lot of money in a very short amount of time while also greatly minimizing the risk involved. Whether these banks meet, exceed, or fall short of their earnings expectations, the straddle strategy can lead you to profits.
Of course, there may be some people who don't yet know what the straddle is and might not have time to read my in-depth write-up about it this very second, but who still want to make profits this earnings season - and that's OK. You still have moneymaking options with options...
For instance, you might consider opening straight calls on the banks you feel confident will continue to increase in price based upon positive earnings results and continued upward momentum in their forward-looking guidance.
All you have to do is wait for the earnings report and guidance, and then wait to see if there is an ideal technical setup before initiating your options trade.
My ideal technical setup, especially on or around earnings reports, is old resistance becoming new support, which I've written about before, or bearish - it all depends upon whether the stock has a breakout or breakdown.
But either way, we make major profits...
In fact, it provides the exact times, the exact dates, and the chance for amazing amounts of money you can collect on a regular basis based on 10 years of data. See how it can give you the opportunity to grab a potential $13,000 in extra cash, right here.
Now let's take a look at a real-world example of this kind of technical setup using the chart below...
[mmpazkzone name="in-story" network="9794" site="307044" id="137008" type="4"]
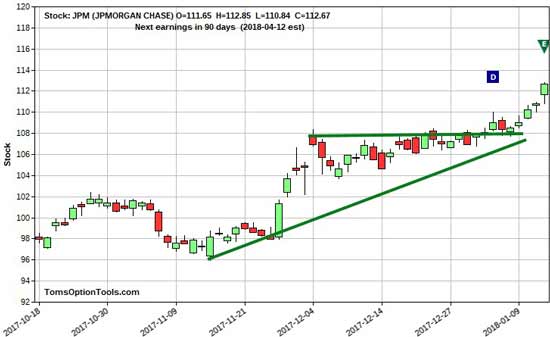
Here, JPMorgan Chase & Co. (NYSE: JPM) displayed a potentially bullish setup. For a while, the stock was showing horizontal resistance at $108. But JPM had a breakout above that level during the days leading into its earnings report on Jan. 12, 2018 (marked by the "E" in the green triangle).
The stock is in good shape right now, but my data have shown me that this isn't a level it can maintain for the long run just yet. Should JPM retrace back to the breakout resistance price of $108 then start to bounce, we then have a great opportunity to buy options on the stock.
In that scenario, we would get in at the lower price, but one that would provide a strong resistance level to protect us from a breakdown. And we would be getting into JPM well before the stock had another breakout. This is a surefire profit strategy. We just need to find the right time to strike.
In the graph, I also drew an ascending support line to show the share movement we should assess when trying to pinpoint a price target ahead of a stock's breakout above the ascending triangle pattern.
We take the difference between the widest two points of the triangle and add that number to the resistance-level price. That new number becomes a potential target for the stock.
In the chart above, the widest points (the bottom of the triangle and the horizontal resistance price) are $96 and $108, which is a $12 difference.
So we take that resistance price at $108 and add $12, which means JPM has the potential of reaching $120. Slightly in-the-money (ITM) calls at least a few months out are a way I could see capitalizing on this setup, pending a successful test of that old resistance point as a new support.
If You Like Fast Cash, You Don't Want to Miss This
I love fast money. That's why I've been working on a new invention. It's a way to get rapid-fire profits in your hands week after week.
I'm talking about trades you can make from anywhere, even right on your phone, in four days or less.
The pattern behind these quick paydays appears every single week. And I'm the only one who knows how to find it.
I've used it to show my readers top gains like 100% on RTN in one day, 100% on BIDU in one day, 120.93% on MS in two days, and 124% on ABBV in one day.
If you hope to find yourself with a pile of extra cash in your pockets, click here to learn more...
Tom Gentile is America's No. 1 Pattern Trader, and for good reason. Since 2009, he's taught over 300,000 traders his option trading secrets, including how to find low-risk, high-reward opportunities. Now he's sharing that insight with you. To get started, just click here – you'll get Tom's twice-weekly Power Profit Trades delivered directly to your inbox, free of charge.
The post Banks Are Releasing Their Earnings Reports; This Is How We Profit appeared first on Power Profit Trades.
About the Author
Tom Gentile, options trading specialist for Money Map Press, is widely known as America's No. 1 Pattern Trader thanks to his nearly 30 years of experience spotting lucrative patterns in options trading. Tom has taught over 300,000 traders his option trading secrets in a variety of settings, including seminars and workshops. He's also a bestselling author of eight books and training courses.