


On July 10, everyone's eyes and ears were on one thing - the Fed. And there's a good reason why.
You see, after the U.S.-China trade war heated up last May, the market fell further than it had all year. And the Fed was the only thing that was able to pull it back up.
Yesterday, Fed Chairman Jerome Powell delivered his long-awaited testimony before the House Financial Services Committee. And the market was listening for one very important catalyst...
Rate cuts.
The Fed's testimony, as expected, was one of the biggest market movers to date. And later this month, we're set to see one that's even bigger.
If you want to bank some serious cash on the fast swing, then this is all you need to know...
Five Things to Expect from the Market's Four Corners
According to Powell's testimony, the U.S. central bank may cut interest rates for the first time in 10 years.
Basically, the Fed chairman said that the rising trade tensions and weakening economy have made the case for a rate cut stronger, and it could be coming by the end of this month. And the market reacted to the news...
Do This Before Monday: Immediately after opening bell Monday morning, we're releasing a brand-new recommendation from this top-100 list. Learn how to get access here.
The NASDAQ closed at all-time highs, and the S&P 500 crossed above the 3,000 mark for the first time ever. Clearly, the market is riding this interest rate high.
To play these rising prices flawlessly, it's important to look at the following four corners of the market...

SPY is an ETF that tracks the S&P 500, and it's the largest ETF in the word. I see 300 as a potential resistance area for SPY. Now, as folks reevaluate value on securities at that level before adding to their stake, there could be a pause in higher prices. But ultimately, I see SPY surpassing that price level and continuing to make new highs, just like it did yesterday.
2. iShares 20+ Year Treasury Bond ETF (NASDAQ: TLT)
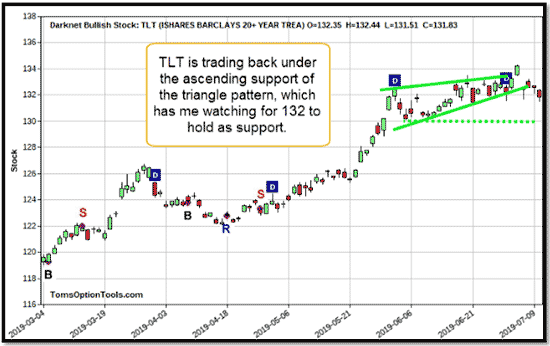
TLT is an ETF designed to track the investment results of an index made up of U.S. Treasury bonds that have remaining maturities greater than 20 years. Last week, TLT looked like it was breaking out of a triangle pattern - but as you can see, it's still there today. What's not there is the price, as TLT is trading under the ascending support line of that triangle.
Right now, this looks like a failed breakout. And if things continue on this track, then that very well may end up being the case. TLT is testing a price level of $132 - if this doesn't hold, then I can see the ETF sliding back down to 130.
Now, the upcoming interest rate cut will undoubtedly affect bonds, and therefore TLT, which could keep it trading in this price area until then. Lately, equities and bonds have both traded higher, so it will be interesting to see if that stays the same after the Fed's decision at the end of the month.
3. Invesco CurrencyShares Euro Trust (NYSE: FXE)
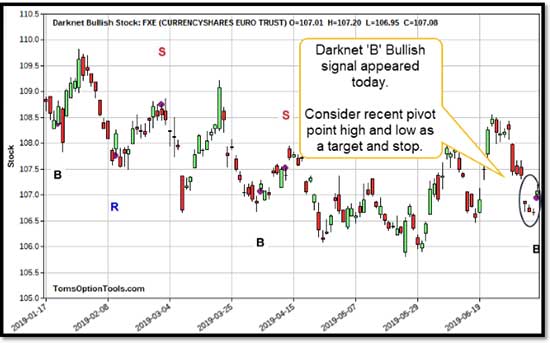
FXE seeks to track the price of the euro - and a bullish signal appeared on its chart today.
Now, I have been keeping an eye on FXE's descending channel over the past few weeks - from when it first broke out to when it fell back into the channel. But that view isn't on my radar right now.
Instead, this bullish signal is showing a potential upward price move.
[mmpazkzone name="in-story" network="9794" site="307044" id="137008" type="4"]
4. United States Oil Fund LP (NYSE: USO)
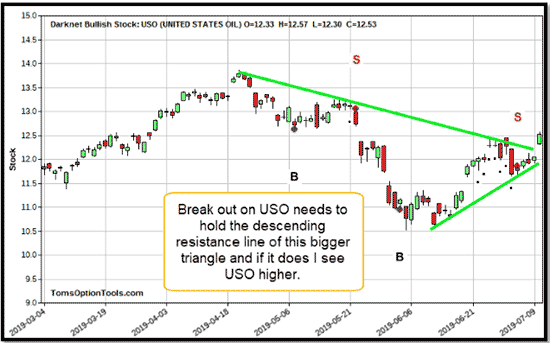
The highest point of the triangle is around the $13.75 price level, while the lowest point is $10.75. Subtract the two, and you have a differential of three points. If you add these three points to the expected breakout price of $12.30, then you have a target point at $15.30.
The key thing to watch here is if the breakout fails. You'll know this is happening if USO trades under the previous resistance and/or support of the triangle. But if the price holds resistance as new support, then we may see higher prices soon.
We know that the Fed's minutes moved the market. But in order to play that move, we need to know where the market is heading next.
With these charts, we can see where historical patterns are taking the market. And then all we need to do is match the right strategy to bank the biggest gains.
Now, I break down strategies like these even further for my subscribers...
Time to Harness the Power of V3 (Before Monday Morning)
When you spot this anomaly... and you tap into it in just the right way... it's possible to shear tens of thousands of dollars right off the top of the market. In fact, this attribute GUARANTEES you will see an opportunity - every single week - that can double, triple, even quadruple your money. And as soon as the market opens Monday, a new recommendation is going live. You can make $10,000, $20,000, even $30,000 a month with this...
The post Exactly What the Fed's Latest Testimony Means for the Market appeared first on Power Profit Trades.
About the Author
Tom Gentile, options trading specialist for Money Map Press, is widely known as America's No. 1 Pattern Trader thanks to his nearly 30 years of experience spotting lucrative patterns in options trading. Tom has taught over 300,000 traders his option trading secrets in a variety of settings, including seminars and workshops. He's also a bestselling author of eight books and training courses.