


Today we're going to continue a conversation we started last Thursday regarding a very accurate and potentially very profitable trading pattern that only few investors are familiar with.
I've gotten lots of great feedback about that article and, as always, thank you!
Frankly, there isn't a single thing I'd rather be doing than helping you make money, build wealth, and live the life of your dreams. I love what I do, and I love the fact that the Total Wealth family has grown from just a few subscribers to the investing giant it is today with a seven-figure readership!
Speaking of which, I've received a number of questions from savvy readers asking if the descending triangle pattern we discussed last week could be played to the upside.
Absolutely!
It only takes one great indicator to make a fortune and two or three trades to make you a legend.
I'd like to see you do both.
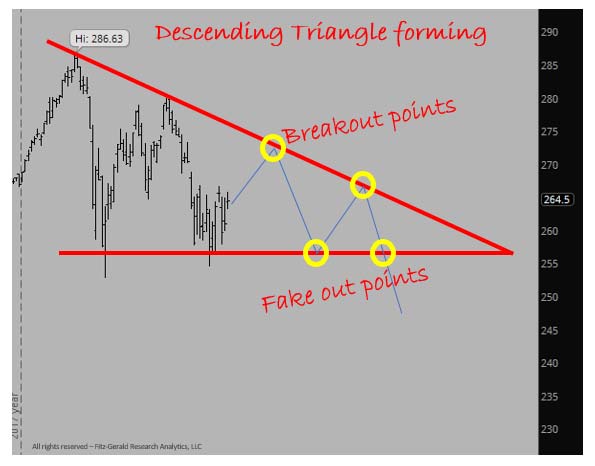
As I explained, the descending triangle is used best when a downward trend is both established and expected.
Right now, that's clearly the case.
You can see that when I superimpose the descending triangle pattern on the SPDR S&P 500 ETF Trust (NYSE Arca: SPY), which mirrors the S&P 500 Index.
If you recall, there are two things that set this pattern apart from the more conventional Bull and Bear Flags - here they are again if you missed 'em!
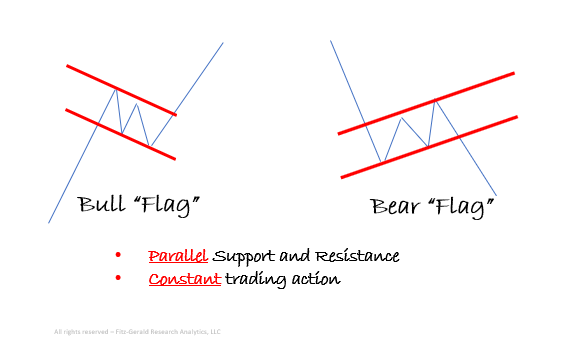
But with the descending triangle:
1) Support and resistance levels are converging instead of parallel.
2) Trading is erratic, with sharp up days typically followed by sharp down days instead of constant.
Contrary to what many investors believe, "why" really doesn't matter. But, just in case you're interested in an explanation, traders around the world - who I talk to every day on your behalf - are concerned, like I am, about the possibility of a trade war between China and the United States, not to mention worries over the increasingly complicated relationship between Russia and the United States.
That means prices are more likely to drift downward, which is where you want to focus, because "bids" - meaning buyers - are hard to come by.
That's the "tradable event" here.
Stunning Video Footage: Watch this guy become $4,238 richer in under a minute - then follow his simple instructions to learn how you could pocket a potential $2,918 in just one move. Click here...
Buying both SPY June and December $257 put options along the "fake-out points" I circled in yellow is the easiest way to play that expectation as well as being the least risky. You know to the penny what you will pay to buy 'em and your risk is limited to what you pony up.
Now Let's Juice That Up for Even More Profit Potential
One of the things that makes a trade like this so profitable is that the rapid changes in price that typically form this pattern often give way to equally rapid changes in volatility. That means you can use both price and volatility to your advantage... especially if there's a reversal to higher prices.
By the way, I'm really proud of you - the fact that I received so many questions about how to play this pattern in the event of a reversal tells me you're engaged, you're thinking outside the box, and most importantly, you're "in to win."
To that end, I can think of three additional ways to play the same descending triangle pattern to the upside:
[mmpazkzone name="in-story" network="9794" site="307044" id="137008" type="4"]
- Buy-to-open SPY June 15, 2018 $275 Call (SPY180615C00275000) and SPY Dec. 21, 2018 $275 Call (SPY181221C00275000).
This gives you plenty of time to let the trade develop but still offers immediate profit potential that can be harvested practically at your leisure between now and their expiration. This is a little different from what I recommended last Thursday, in that you'll be buying calls, which are a bet that prices move higher, instead of puts, which are a bet that prices move lower.
At the same time, you're creating a "staggered" approach you can use to harvest the short-term volatility most investors will miss. That sounds complicated but it's really not.
The theory I'm describing is a lot like driving between the white lines at the edge of the road... drift right, and you steer left... drift left, and you steer right. Only in this case we're talking about prices moving higher and lower in erratic trading.
Big up days will make both these options move, so your goal here is to harness the short-term volatility that makes traders "steer" up and down. Ideally, you'll want to buy these on big down days when prices and call-side volatility decline so you'll get the best prices.
A “Blueprint to Financial Freedom”: America’s #1 Trader used this secret to become a millionaire. Now he’s sharing it live on camera – and you could learn how to set up a series of $822… $1,190… $2,830 payouts every single week.
I suggest you have a series of profit targets in mind depending on your time perspective and personal risk tolerance - i.e., 10%, 50%, and 100% - at which point you take the money and run. Then, repeat the process using your newly found bankroll to place additional trades as long as the pattern holds.
Volatility usually expands as prices move, so you can do this in a wide variety of time frames depending on your personal risk tolerance and investment objectives. The concept is universal, so everything from daily, to weekly, to monthly... even yearly applies.
- Sell SPY put spreads at or near the $257.00 line on my chart.
The key to this alternative is that you'll have to wait until prices approach the bottom line of the triangle to maximize returns. Doing so can take nerves of steel because seemingly everybody and their mother will be running for the exits... but don't let that put you off.
You have an advantage over other investors in that you know where the "bottom" is likely to be because of the descending triangle pattern we're talking about today; 99% of the traders you're up against will be flying blind and falling prey to their emotions.
Try selling the SPY June 15, 2018 $257/$252 Put spread and the Dec. 21, 2018 $257/$252 Put spread. Right now those spreads are trading at $1.21 and $1.52, which means that you'll receive $121.00 and $152.00 for each contract.
Here, too, risk is limited because the put you'll be purchasing offsets the one you'll sell. This is a particularly solid trade for folks with a limited bankroll or those who are just learning to trade, as opposed to invest.
- Buy SPY call spreads at or near the $275.00 breakout points on my chart.
Ideally, you'll want to do that when prices have dropped at or near the lower line of the descending triangle. Volatility will have risen on the put side but dropped precipitously on the call side, which makes call options comparatively "cheap" at the moment you make your move.
My suggestion is the SPY June 15, 2018 $275/$280 Call spread or the SPY Dec. 21, 2018 $275/$280 Call spread. Right now, they're trading at $1.33 and $2.33, respectively, but I think you'll be able to pick them up for a whole lot less as markets deteriorate and, ultimately, turn.
As is the case with the put spreads I've just mentioned, the risk is limited. However, so's the profit potential, which maxes out at the difference between the two strike prices.
In closing, I've tried to keep today's column simple so that as many readers as possible can benefit from the discussion.
More aggressive traders could use any number of additional techniques to play along with the same pattern, too. Examples that come to mind include calendar spreads, diagonals... even volatility arbitrage could work. But again, my goal is to keep things simple.
I want to maximize your profit potential every time I put pen to paper or my fingers to the keyboard.
We'll have plenty of time to talk about more advanced trades down the line - the markets aren't going anywhere, and neither am I.
Up Next: Conquer the Market with This Virtually Bulletproof Strategy
If you've been heeding Keith Fitz-Gerald's recommendations, you'd never know the markets have been going haywire - because his virtually bulletproof Velocity strategy has closed out a market-crushing 14 winners so far in April, for total gains of 571.03% (including partial closeouts)!
And while a lucky group of his readers have the chance to cash in more than once per day on average, you've been missing out.
To learn how to join before you lose out on another money-multiplying opportunity, click here now.
The post 3X the Profit Potential by "Inverting" this Little-Known Pattern appeared first on Total Wealth.
About the Author
Keith is a seasoned market analyst and professional trader with more than 37 years of global experience. He is one of very few experts to correctly see both the dot.bomb crisis and the ongoing financial crisis coming ahead of time - and one of even fewer to help millions of investors around the world successfully navigate them both. Forbes hailed him as a "Market Visionary." He is a regular on FOX Business News and Yahoo! Finance, and his observations have been featured in Bloomberg, The Wall Street Journal, WIRED, and MarketWatch. Keith previously led The Money Map Report, Money Map's flagship newsletter, as Chief Investment Strategist, from 20007 to 2020. Keith holds a BS in management and finance from Skidmore College and an MS in international finance (with a focus on Japanese business science) from Chaminade University. He regularly travels the world in search of investment opportunities others don't yet see or understand.