


Momentum investing has a bad rap.
Over the past 35 years, I've heard it referred to as a "strategy for idiots" or a foolish undertaking on par with a good old-fashioned game of "hot potato"... usually by Wall Street types or academics who look dismissively down their nose at anyone suggesting something different.
The irony, of course, is that momentum investing works.
What's more, momentum investing:
- Is simple to use
- Easy to understand
- Can keep you out of trouble if the markets roll over
The premise is very straightforward.
Stocks that are doing well continue to do well, and stocks that are doing poorly continue to do poorly - which is why, of course, you buy the former and sell (or avoid) the latter.
Critics charge that such a simple concept can't possibly work in today's complicated financial markets. And, having bought off on that line of thinking, most investors are deeply skeptical.
But again... momentum investing works.
Very well.
A 2014 study in the Journal of Portfolio Management by Clifford Asness, Andrea Frazzini, Ronen Israel, all of AQR Capital, and Tobias Moskowitz of Yale University, showed that momentum investing averaged 8.3% a year from 1927 to 2013 versus barely half of that - just 4.7% - from value stocks.
That's a 2-to-1 advantage and enough to turn every $10,000 invested and compounded into a $4.2 million versus only $330,000 from value investing, one of the most widely documented strategies and Warren Buffett's favorite, by comparison.
Other studies reflect similar results, my point being that this isn't a one-off nor am I cherry-picking data.
Technical traders attribute momentum to a constant series of reactions between overbought and oversold conditions. Behavioral scientists think that momentum is a feedback mechanism driven by social behavior and emotions like greed and fear.
My take is that the truth is somewhere in between - that momentum exists and has a very real impact on profits is irrefutable.
Keith is wagering nearly $10 million that average gains of 313% PER WEEK (including partial and full closeouts) are possible whenever this pattern appears in regular stocks. Click here for more details…
Professor Eugene Fama of the University of Chicago's Booth School of Business even went so far as to call momentum "the premier market anomaly," noting that stocks with "low returns over the past year tend to have low returns for the next few months and stocks with high past returns tend to have high future returns."
He ought to know.
Fama won the 2013 Nobel Prize for economics for his work on the relationship between risk and expected returns as they relate to modern investment theory.
There are all kinds of ways to measure market momentum, ranging from absurdly simple to formulae so complicated that you'll need a rocket scientist at your side to interpret 'em. Stick with the simple.
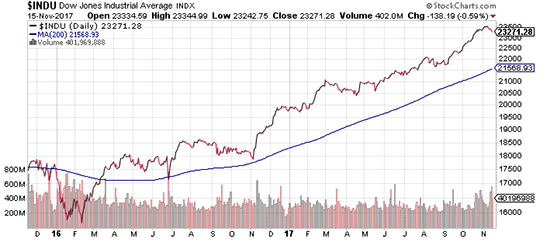
The easiest way to measure momentum is a 200-day simple moving average. You'll hear this talked about a lot on financial programs because it's easy to understand and many institutional investors use it as a gauge measuring... you guessed it... momentum.
If markets are above the 200-day SMA, conditions favor buying. If the markets are below it, conditions favor selling.
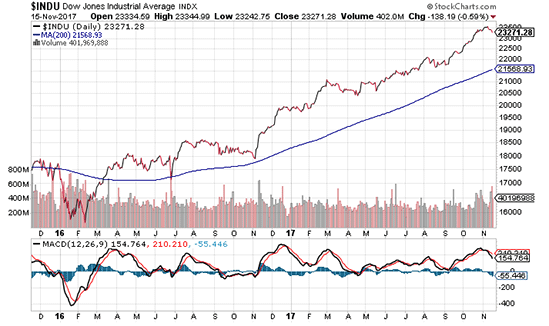
Using combinations of moving averages like the moving average convergence divergence, or "MACD" for short, is also very popular.
The MACD also a momentum-driven indicator, only it shows the relationship between two or more moving averages by taking the difference of the faster (shorter time frame) from the slower (longer time frame) line.
The shorter line becomes the signal line, meaning you buy or sell as it crosses the longer average because it reflects more "immediate" momentum in the markets as a whole or in specific stocks that interest you.
My favorite momentum indicator, though, is something even simpler.
[mmpazkzone name="in-story" network="9794" site="307044" id="137008" type="4"]
Originally developed in 1995 by an innovative technical analyst, it's an improvement on both the 200-day moving average and the MACD I've just described. Because of the way it's calculated, this particular indicator can identify powerful new trends more consistently, more quickly and, my testing suggests, far more profitably than other indicators.
If the indicator signals higher, you buy. If it's headed down, you sell.
What I like about it most though is that anybody can use it. You don't need to interpret reams of data nor do you have to make subtle inferences like you do with many other trend-oriented indicators.
In fact, if you can read an "X," you can use this indicator to identify quick, aggressive gains happening every day in the stock market.
When the "X" shows up... it's time to buy. And when it shows up again... it's time to sell.
I was so surprised by how effective this indicator was when I first learned about it, I immediately knew I had to test it - and did so for more than a decade.
Then, my team and I tested it some more using another 16 years of data just to make sure we were all seeing what I thought I was seeing.
We threw every scenario we could think of at the calculations driving this indicator... bull markets, bear markets, the "dot-bomb" crash and recovery, the global financial crisis... and more. We tested it with market indices, ETFs, individual stocks, bonds... you name it.
When we came out on the other end, we had something truly incredible on our hands.
Not only did this indicator prove to be just as effective as I thought, but it was so good that I built it into a powerful proprietary strategy that's at the core of my sister research service, High Velocity Profits. Over the past 30 days it's identified 313% total gains per week on average (including full and partial closeouts) and more than 53 triple-digit winners this year alone.
Obviously, that could change at any moment, but I don't think it will.
In fact, I just made a $9.75 million bet that my proprietary "X" strategy will continue to deliver life-changing profits - the likes of which could even jumpstart your retirement by a decade or more.
Right now I'm seeing "X's" in several groups of stocks... healthcare, defense, and even big tech... and that means money is on the move.
...and the X will tell you when to make yours.
The post The Secret to Momentum Investing I Wish Every Investor Knew appeared first on Total Wealth.
About the Author
Keith is a seasoned market analyst and professional trader with more than 37 years of global experience. He is one of very few experts to correctly see both the dot.bomb crisis and the ongoing financial crisis coming ahead of time - and one of even fewer to help millions of investors around the world successfully navigate them both. Forbes hailed him as a "Market Visionary." He is a regular on FOX Business News and Yahoo! Finance, and his observations have been featured in Bloomberg, The Wall Street Journal, WIRED, and MarketWatch. Keith previously led The Money Map Report, Money Map's flagship newsletter, as Chief Investment Strategist, from 20007 to 2020. Keith holds a BS in management and finance from Skidmore College and an MS in international finance (with a focus on Japanese business science) from Chaminade University. He regularly travels the world in search of investment opportunities others don't yet see or understand.