


Look, I get it. Learning the ropes in the market can seem like a daunting task.
Unless you're an experienced trader, trying to follow along as someone spits out a bunch of technical indicators and unfamiliar jargon can leave you feeling like you're in over your head.
But as someone who started form the bottom with very little knowledge of the market many years ago, and has since trained hundreds of thousands of people how to effectively trade, I'm here to tell you that you've got this.
And I want to help you get there.
Today, I want to provide some insights into a phrase you may hear or see a lot when researching your trading.
It's an incredibly simple yet important indicator that traders have been using for decades to spot stocks on the move, both up and down, and plot their trades by.
And it's something I've been using as the basis for one of my best-performing trading strategies over the past year.
Let's take a look at how this one easy-to-use tool can help you improve your trading...
The Power of the Moving Average
The basic function of a moving average is to smooth out price data over a specified amount of time by calculating an average price movement.
This allows traders to more clearly see trends in price movement by filtering out short-term price fluctuations. It is also useful in determining support and resistance levels.
A Simple Moving Average SMA is calculated by taking the close prices of a security, adding them up, then dividing by the number of days.
To give you a simple example, let's say The Coca-Cola Company (KO) closed at $61, $65, $62, $67, and $66, the formula to calculate a 5-day SMA would be...
(61+ 65+ 62+ 67+ 66) ÷ 5
Your SMA for the past 5 days would equal 64.2. Moving average can then be charted by taking the next day's closing price and adding it to the equation, while removing the oldest day's price.
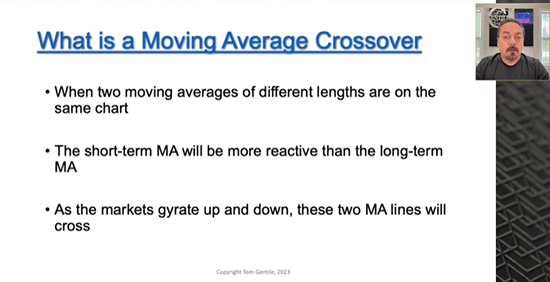
While this data can be very useful in and of itself for establishing trend and momentum, and even more powerful indicator occurs when a short-term moving average line crosses over a longer-term moving average line on a chart.
Since short-term moving averages typically move with greater volatility than the longer-term moving averages that are more smoothed out, a short-term moving average crossing above a long-term moving average is regarded as a buy signal, since the price trend is moving up. A short-term moving average crossing below a long-term moving average is regarded as a sell signal.
This has been a strategy used to great effect by traders for years. In fact, I recently broke down the moving average cross and why it is such an effective tool during an appearance on Money Morning Live.
 But as you'll see if you watch the video, I also discussed the limitations and downside in how most analysts use moving averages.
There's a much more effective moving average strategy that is geared towards finding stronger short-term trends that are perfect for the kind of quick profit options trades that I prefer.
The 10/30 Strategy
As you saw in the recording above, one of the most popular MA crosses is the 50-day and the 200-day.
These moving averages are great predictors of support and resistance. Stocks often "bounce" off these lines and go back the other way... These "bounces" will show you a good time to buy or sell stock/options.
But for the type of options trading that I've spent my career perfecting, I use the 10-day and 30-day moving averages to spot strong bullish and bearish trends that we can then use the power of options to leverage into huge profits.
Shorter-term moving averages like the 10-day and 30-day moving averages more closely follow the price movement of stocks and are useful as timing indicators when they cross.
And that's where the 10/30 moving average steps in.
So, let's start with the basics:
- If the 10-day MA crosses ABOVE the 30-day MA, enter bullish trade (or exit bearish).
- If the 10-day MA crosses BELOW the 30-day MA, enter bearish trade (or exit bullish).
What's exceptional about this system is that it works more often than it doesn't, winners are bigger than losers, it makes money... and it's incredibly simple.
But this strategy can be improved upon, and that's exactly what I've done with my Quantum Scripts technology.
At the heart of this amazing software is the moving average cross, the basis by which it identifies stocks with the strongest short-term momentum.
From there, that's when the Quantum Scripts really goes to work...
By mining billions of pieces of data - including price, volume, beta in real-time, and lesser known, key predictors like convergence, velocity, variance, volatility, and even sentiment - my proprietary technology helps me to identify the best momentum stocks to trade.
Using the power of options, we're able to turn the exclusive intel the Quantum Scripts provides into huge profits!
And the best part is, it couldn't be easier for you to take advantage of, because I send out the exact trades to take straight to your inbox.
I spent years, developing and back-testing this technology and the trading strategy I use in conjunction with it. But I don't need to talk about back-testing anymore. The real world results we've had using this system in Quantum Data Profits speak for themselves...
Since the first trade I recommended back on March 3, 2022, we've closed an awesome 65% of our trades for profit. And by letting our winners run while effectively managing losing trades, Quantum Data Profits members have had the chance to turn a $5,000 account into $32,000.
Think about what you could do with that extra money in your pocket.
Heck, that's more than what the average American pays for the mortgage on their house every year!
That's the kind of trading success and financial stability that I've dedicated myself to helping others achieve - and I want you to experience that for yourself.
The time to join the Quantum Data Profits revolution is now.
My team and I are currently hard at work making the Quantum Scripts even better... with all new AI-powered dynamic optimization, smart pattern recognition, automated precision targeting, and other powerful upgrades.
Now, that sort of research and development isn't cheap. I've held the introductory offer to join Quantum Data Profits open for as long as my publisher will allow, but today is your last chance to join for a price that may never be this low again.
After today, the current discounted offer will be off the table.
If you want more information on all of the many benefits of being a Quantum Data Profits member, you can find it right here.
Or you can also give Gabe and his VIP team a call at 855-509-6600 and they'll be happy to answer any questions you may have.
I really hope to see you in our next members-only Quantum Data Profits live weekly training session, and to continue the success we've been enjoying with you!
Sincerely,

Tom Gentile
America's #1 Pattern Trader
The post The Simple Indicator That's Sparking a Trading Revolution... appeared first on Power Profit Trades.
About the Author
Tom Gentile, options trading specialist for Money Map Press, is widely known as America's No. 1 Pattern Trader thanks to his nearly 30 years of experience spotting lucrative patterns in options trading. Tom has taught over 300,000 traders his option trading secrets in a variety of settings, including seminars and workshops. He's also a bestselling author of eight books and training courses.