


We can finally stop talking about the debt ceiling! (For now...)
But while everyone else goes from processing the exciting conclusion of the debt ceiling standoff...
...to dissecting whether or not the Fed will raise rates again in 11 days...
I want to move on to the actual next big profit opportunity.
Just like the great Wayne Gretzky famously said, I want to skate to where the puck is going to be, not where it has been.
That can be a hard trick to pull off in hockey; that's why Gretzky was great. But for options traders, there's a trick we can use to see the exact path the puck will take.
It's called IV Rush, and it's the secret sauce I use to trade earnings season. Here's how it works...
One of the least understood and most powerful components of option prices is Implied Volatility (IV). Simply said, IV can be thought of as demand for a stock's options. As the demand (IV) for those options rises, so does their value.
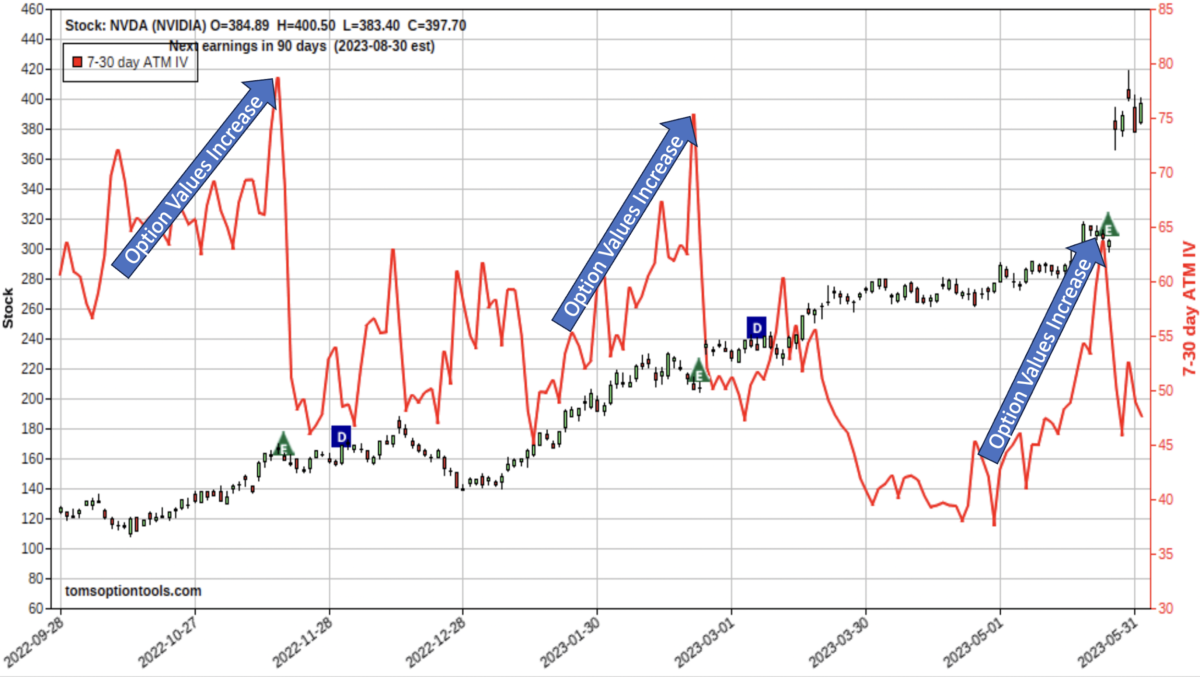
Take this price chart of high-flier Nvidia (NASD: NVDA) that shows the IV Rush concept in action. The red line shows IV. The green "E" triangles are earnings dates.

As each earnings date gets closer, NVDA's IV - and therefore, option values - increase dramatically.
Why?
Demand for the options increases as the event approaches. Option traders are willing to pay more for options with the expectation that the stock will move after the company announces earnings. This is called IV Rush. Immediately following - once the news is out - option premium tanks.
What's amazing about this IV Rush pattern is that it's very tradable. We see it happen CONSISTENTLY and REPEATEDLY on most stocks. In fact, it is more reliable than stock price movement.
That means you will make more money on your winning trades and lose less on your losers. It's like playing with a safety net.
Here's another prime example...
Check out this scan result on Intuitive Surgical (NASD: ISRG).

I scanned for stocks that consistently move up or down into earnings and selected the appropriate option type. The results not only tell us the averages IV Rush over four earnings periods, it also gives the average ROI % buying the selected option type.
As you can see in the ISRG chart below, IV rises consistently into each earnings date before plummeting after the news is released.

The next round of earnings releases are slated for July, which means now the perfect time to load up on CHEAP options... before the IV Rush pushes values higher.
With the winds of history at our back, we can use this pattern to maximize our potential profit!
To learn more about my volatility-trading strategy, give Gabe and his VIP team a call at 855-509-6600. They'll be happy to answer any questions you may have.
To your continued success,

Tom Gentile
America's #1 Pattern Trader
The post This Secret Options Pattern Is More Reliable than Price Movement appeared first on Power Profit Trades.
About the Author
Tom Gentile, options trading specialist for Money Map Press, is widely known as America's No. 1 Pattern Trader thanks to his nearly 30 years of experience spotting lucrative patterns in options trading. Tom has taught over 300,000 traders his option trading secrets in a variety of settings, including seminars and workshops. He's also a bestselling author of eight books and training courses.