


When I started Total Wealth, I promised you that I would cover the best companies, trends, and investment opportunities I could find. I also promised you a look at the specific tactics needed for big profits whenever I saw special situations developing.
Today, I'm going to keep that promise with a look at Tuesday's trading and a classic chart pattern in formation that can yield big profits in the hands of those who know how to trade it.
I'm referring, of course, to the fact that markets rocketed higher following a speech on Tuesday by Chinese President Xi Jinping at the Boao Forum for Asia, in which he highlighted plans to open up the nation's domestic economy to foreign businesses.
Specifically, Xi stated that China will increase imports, significantly lower tariffs on imported automobiles, speed up financial market development, and boost enforcement on intellectual property protection.
Strategically, we've got this covered and have had it covered for a long time. If you're just joining us - you're in for a profitable treat!
Here are just a few of the companies we've discussed:
- Tesla Inc. (Nasdaq: TSLA): China is Team Musk's second-largest market, with sales of more than $2 billion there in 2017 alone. Shorting a company like Tesla right now might prove to be full of profit potential. In fact, premium subscribers were recommended just that at a time when the stock was moving down in the past, and they had the opportunity to close out on two legs of the same trade for a total of 121.41% gains. Just click here for more information about this strategy.
- BlackRock Inc. (NYSE: BLK): CEO Larry Fink laid out why China is a critical priority in his company's 2017 annual report, citing the same three primary "Unstoppable Trend" subsets we prioritize when it comes to the Red Dragon as being the driver... demographics, economic, and regulatory shifts.
- Alibaba Group Holding Ltd. (NYSE: BABA): The e-commerce giant is the only company capable of giving Amazon.com Inc. (Nasdaq: AMZN) a true run for its money and - gasp - potentially winning the fight. It's working on a plan to list shares in mainland China, not Hong Kong, as many people believe and as has been widely reported. This could immediately unlock a huge pool of captive money that could double shares when Chinese investors have access through a secondary listing.
Tactically, though, the situation is very different.
I think there's a good case to be made that Xi is setting up a world-class "fake-out"... not the "breakout" that everybody thinks as I watch and while I write (Tuesday, April 10). It's based on what's called a "descending triangle pattern."
You're not alone if you've never heard of it.
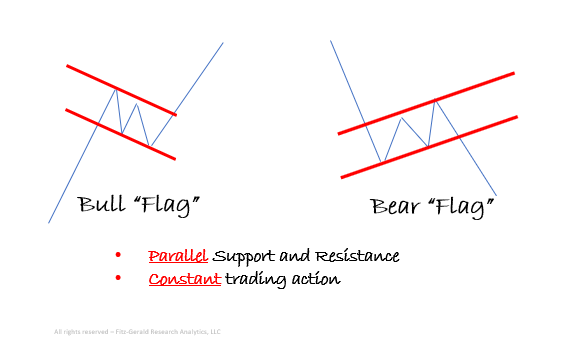
Triangle patterns are different from the classic bull and bear flag patterns, below, which most investors typically learn when they're introduced to technical analysis for the first time.
Bull and bear flags have two defining features. The trading action is constant, and the support and resistance levels needed to chart the pattern are parallel in both directions, up and down.
Now, here's the triangle.
There are three types of triangles, and in each case, you have converging prices representing support and resistance as well as erratic trading.
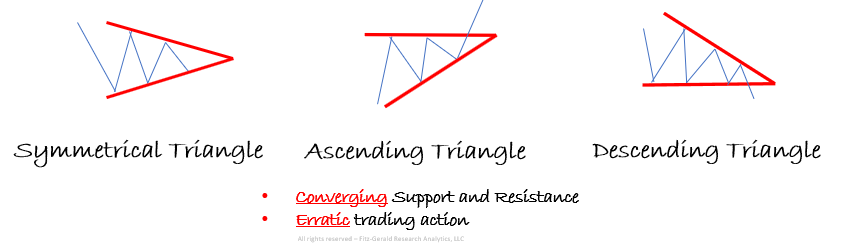
In this case, it's the one on the right that concerns us... the descending triangle.
That's What Prices "Look" Like at the Moment
Let me show you.
[mmpazkzone name="in-story" network="9794" site="307044" id="137008" type="4"]
Here's a chart of SPY (that's the exchange-traded fund tracking the S&P 500) with the descending triangle pattern superimposed.
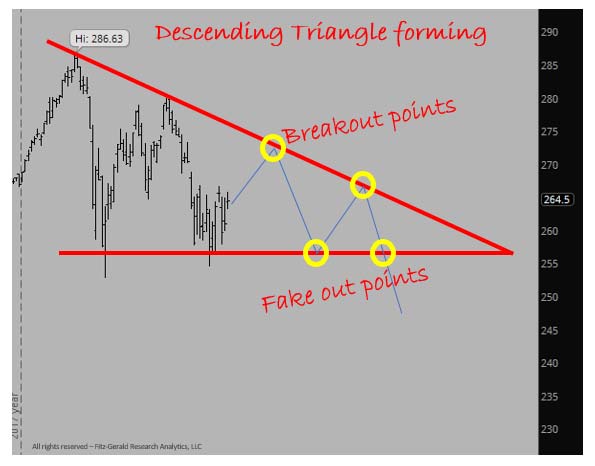
You can see very clearly that:
- SPY would have to trade through 270 or so and stay at that level or higher to even remotely be considered a legitimate breakout, never mind the headline hype.
- The "fake-out" is far more likely in a down-trending market.
Now, Here's the Fun (and Potentially Very Profitable) Part
Many investors get so wrapped up in the headlines that they forget that there's a lot of information that can be derived from technical analysis - meaning price action.
Both breakout and fake-out trades are ideally suited for market conditions like the present because of the increased volatility and momentum that accompanies both.
At the same time, both breakout and fake-out trades can significantly improve your self-confidence as a trader because, more often than not, they can really boost your returns. Never forget that it only takes two or three great trades to be a legend!
Personally, what I like most about 'em, though, is that you can use "triangle" trades with any priced security - stocks, bonds, ETFs - as long as you see the patterns we've discussed today and can identify the likely entry points I've circled in yellow in the prior image. They can take a while to "form," so you don't have to make rash decisions.
My experience suggests that current price action clearly suggests a downward trajectory that is likely to continue by virtue of the fact that we can see the descending triangle in formation. Fundamentally, that matches up with what I know about how the Chinese are known to manipulate markets and trade to meet their objectives, despite telling the West exactly what they want to hear. It also matches up with erratic trading related to everything from dysfunctional politics to Russian relations, which are growing more complicated by the minute.
I suggest buying two put options, each with a further expiration date so that you can give this situation time to play out.
- Buy-to-open: SPY June 15, 2018 $257 Put (SPY180615P00257000)
- Buy-to-open: SPY Dec. 21, 2018 $257 Put (SPY181221P00257000)
Your exit instructions are simple.
Sell half of each position for a quick double when and if traders reverse course for any reason. That will allow you to create a "Free Trade" that pays for your initial investment and allows you home-run potential as the situation continues to develop.
I would consider shutting down the trade completely if the S&P 500 does, in fact, close above one or both of the breakout points I've identified. That would likely mean a loss, albeit not a big one.
In closing, trades like this are clearly speculative in nature. Chances are, you'll win some and you'll lose some as you learn to work with the patterns over time - which is why I want you to remember that it only takes one good indicator to build a fortune...
Your Financial Future Is at Stake (Are You Prepared?)
I recently shared a chart eerily similar to one I presented in 2007 – just months before the epic 2008 crash that pushed our financial system to the brink.
It shows we could be in for another white-knuckle ride… a “Great Reckoning,” if you will.
The vast majority of folks don’t see this coming, and those few who do are not preparing properly… nor profitably.
So ask yourself, right now: Are you where you want to be financially?
If the answer is yes, that’s great.
If the answer is no, then please understand that you are NOT alone – and you need to click here now...
The post Trade Xi Jinping's Speech Using this Little-Known Pattern appeared first on Total Wealth.
About the Author
Keith is a seasoned market analyst and professional trader with more than 37 years of global experience. He is one of very few experts to correctly see both the dot.bomb crisis and the ongoing financial crisis coming ahead of time - and one of even fewer to help millions of investors around the world successfully navigate them both. Forbes hailed him as a "Market Visionary." He is a regular on FOX Business News and Yahoo! Finance, and his observations have been featured in Bloomberg, The Wall Street Journal, WIRED, and MarketWatch. Keith previously led The Money Map Report, Money Map's flagship newsletter, as Chief Investment Strategist, from 20007 to 2020. Keith holds a BS in management and finance from Skidmore College and an MS in international finance (with a focus on Japanese business science) from Chaminade University. He regularly travels the world in search of investment opportunities others don't yet see or understand.