


One of the first things you learn when you jump into the stock market is to pay attention to what the herd's doing...
But while it's true that trends can lead you to some of your biggest wins, they can also rip you away from your profits if you're not careful.
And that's exactly why I'm going to show you how to pick the right market trends to fatten your portfolio each and every time.
Here's what I mean...
The Key to Trends Is Timing
You've probably heard the trading adage, "The trend is your friend." This basically means that the best way to increase your odds of winning is to find a trend and jump on for the ride.
This is all well and good; however, trends end. So really, the actual trading adage you should consider is, "The trend is your friend, except at the end."
Finding a trend is easy, but the million-dollar question is how long it will last or how strong it is.
As long as you can, you can jump on the trend and reduce your chances of getting in at the end - when you don't want to catch the ride.
The Ultimate "Money Machine": This simple strategy gives you the opportunity to collect money every 15 days on average... resulting in a yearly income of $162,000. Read more...
So, here's the good news!
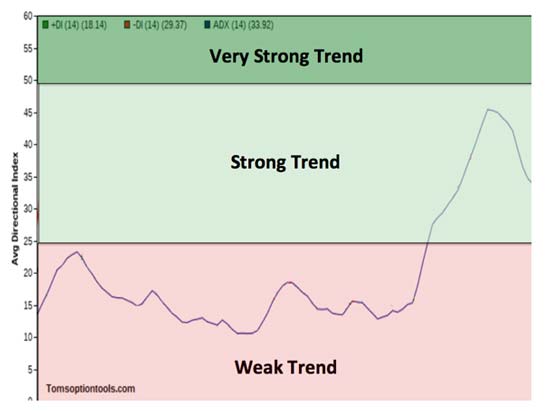
It's easy to determine trend strength using Welles Wilder's Average Directional Index (ADX) indicator. The ADX measures price range expansion or contraction over a period of time (usually 14 days). It's important to know that this is not a directional indicator, but a trend strength indicator.
On a scale from 0 to 100, ADX trend strength is easy to determine.
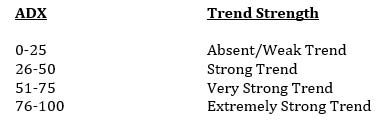
So, by simply pulling up ADX on your charts, you now have a very easy way to determine whether the trend has legs or may be faltering. Enter trending trades only if the ADX line is above 25 - the higher the better.
The indicator further breaks down trend strength into bullish and bearish trend pressure with positive (+DI) and negative (-DI) directional movement indices. Bullish trends are revealed when the +DI is above the -DI. Bearish trends are revealed when the -DI is below the +DI. You can also time your bullish and bearish entries when these two lines cross.
Let's break this down with a recent example on the S&P 500 SPDR (NYSE Arca: SPY).
[mmpazkzone name="in-story" network="9794" site="307044" id="137008" type="4"]
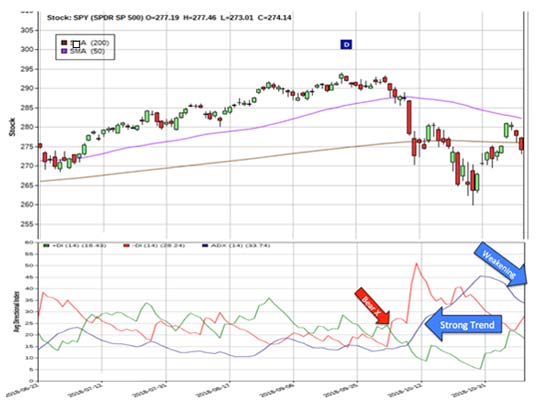
First, the green and red lines on the chart are the +DI and -DI, respectively. When the +DI crosses above the -DI, you have a bullish signal. When the -DI crosses above the +DI, you have a bearish signal.
In early October, before the SPY crossed below its 50-day moving average (purple line), the -DI crossed above the +DI, signaling a potential bearish move. A few days later the ADX line (blue) crossed above 25, indicating a strong trend. Had you entered a bearish trade then, you'd have scored a nice profit as the SPY dropped to 260.
But the power of ADX doesn't stop there.
After the SPY bounced off 260, beginning a snap-back rally, notice how the ADX line dropped - indicating trend weakness on the rally. This could be an indication of further downside in the markets.
And here's a list of the strongest trending stocks in the S&P 500 currently:
![]()
Some of these are bulls and some are bears, so be sure to check out the charts. But they all have one thing in common: strong trends. You'll also notice that all of them entered "strong trend" territory within the last three days.
This, paired with technicals like the Relative Strength Index, the Moving Average Convergence Divergence, moving averages, support/resistance, and others can lead you to the biggest portfolio-boosting trends - and help you avoid even the worst trend "bite backs."
Now, these techniques are great to reduce your risk when it comes to trading...
But there's one more strategy I've designed that gives you a chance to make money whether the markets are up or down.
In fact, it works best during times of high market volatility.
Now, this strategy is so effective because it's backed by my patent-pending investing tools that are able to find obscure, decade-long patterns that have repeated with 90% to 100% accuracy...
And it's so lucrative that my readers had the chance to score gains like 167.86% on URI in 24 days, 101.64% on BIDU in 30 days, 151.30% on AAPL in 10 days, and even 145.27% on AMZN in 17 days.
Click here to learn how to put this strategy into play today.
The post Avoid the "Trend Bite Back" Using This Simple Strategy appeared first on Power Profit Trades.
About the Author
Tom Gentile, options trading specialist for Money Map Press, is widely known as America's No. 1 Pattern Trader thanks to his nearly 30 years of experience spotting lucrative patterns in options trading. Tom has taught over 300,000 traders his option trading secrets in a variety of settings, including seminars and workshops. He's also a bestselling author of eight books and training courses.