


Many investors try to time the markets despite overwhelming evidence that doing so is a fool's errand.
I totally get where they're coming from.
The idea of picking market tops and bottoms is very seductive, but they may as well be trying to catch falling knives.
According to Nobel Laureate William Sharpe, the average investor would have to be right a staggering 82% of the time just to match "buy and hold" returns. Most investors will never get close.
Which is why the odds change radically in your favor if you learn to anticipate when market conditions favor buying or selling.
I've only seen one indicator over the past 35 years that works consistently enough to help you anticipate corrections before they happen and rallies before others see them coming.
Market timing does not work.
Understanding sentiment, on the other hand, does.
It's not a perfect science but it's the best we've got because it preys on weaknesses most investors don't know they have.
Pay attention because it will can help you identify the best times to put your money to work and those instances where caution is the better course of action.
By tracking sentiment.
Sentiment - Not Logic - Tells You Where Things Are Going
If you stop and think about it for a moment, tracking sentiment instead of logic (like everybody else does) makes a lot of sense.
The financial markets are a construct that embodies the collective wants, desires, and aspirations of millions. As such, they reflect emotion, which is of course driven by sentiment.
Therefore, it stands to reason that if you understand what kind of "mood" the markets are in, you can make the right moves ahead of time and gain the upper hand when it comes to building wealth.
One of the best ways to do that is via a technical tool called the "put/call ratio."
It's the only tool I've seen in more than 35 years of analyzing markets that works consistently and accurately to catch every single one of the market's major turning points since it was created.
The put/call ratio measures sentiment by calculating the difference between thousands of put and call options traded in the U.S. stock markets.
Viewed as a proportion, the ratio can be calculated on any given stock, ETF, index, or other investable instrument for which there are options traded. That means you can apply it to individual securities, too.
Generally speaking, higher readings reflect more calls being traded (as stocks fall), which suggests traders anticipate higher prices ahead. Conversely, lower readings suggest that there are more puts being traded as a hedge (as stocks rise), so lower prices could be just around the corner.
The problem is that when you look at the data in isolation, the put/call ratio resembles an EKG from hell or an earthquake tremor map, depending on your perspective.
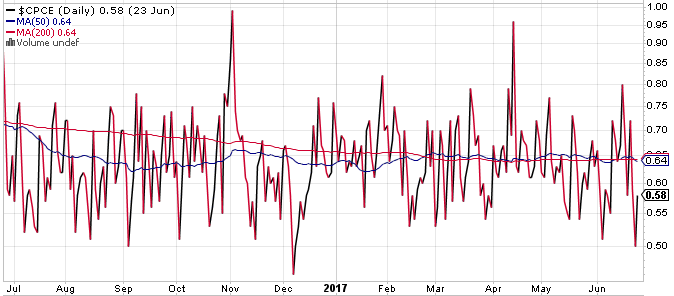
To get around that, most traders "smooth" the data over a period of time using a moving average to get what's called a "normalized" ratio that's not so spikey as to be useless. Day traders with short attention spans seem to like 10 to 15 days. Position traders may push out to 200 days or more.
Here's what I suggest.
Start with a 20-day period, because that's a good approximation of the market cycles an average investor is going to encounter. Depending on your view of things, you can lengthen or shorten this as you wish - depending on your individual preferences.
There's also something called the weighted put/call ratio. In contrast to the regular put/call ratio, which captures volume only using the number of contracts traded, the weighted put/call ratio is a mathematical blend of volume and price. The thinking is that traders will spend more money as they become more emotional near market tops and bottoms, which certainly jibes with my experience.
Here's How to Read the Ratio (and the Advantages It Gives You)
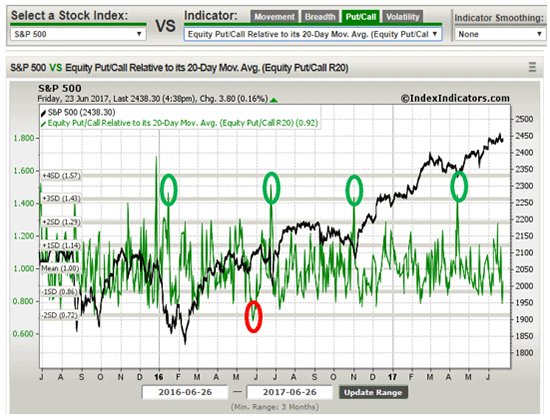
For example, take a look at this chart that overlays the S&P 500 Index against the 20-day moving average of the put/call ratio:
At first glance, it's a squiggly mess.
But if you relax and let the lines talk to you, a very clear picture emerges, as do a few key takeaways.
First, there have been four times the put/call ratio has hit 2 standard deviations since January 2016 - circled in green. Each time, the markets have moved higher following the bullish sentiment associated with trading more call options than put options.
Second, there has been one time the put/call ratio has hit -2 standard deviations, which I've circled in red. Each time, the markets have fallen following bearish sentiment associated with trading more put options than call options. Not immediately, mind you, but close enough for government work, as the old expression goes.
Here's the thing. Knowing how to read this chart would have:
- Allowed you to capture every single one of the market's major turning points over the past year and a half; and
- Helped you know when conditions favored buying or selling.
If you're like a lot of people, you may be kicking yourself right about now because you're imagining how much more money you could have made - or could be making. That's perfectly normal (and a valuable part of learning, too).
But, let's look forward. What's the put/call ratio telling us now?
[mmpazkzone name="in-story" network="9794" site="307044" id="137008" type="4"]
What the Put/Call Ratio Says Today
Right away we see that the S&P 500 Index is topping out. To my naked eye, it appears to be losing momentum and seems like it wants to roll over like a Slinky going down the stairs.

However, the put/call ratio is not trading outside of 1 standard deviation, which means that traders are not especially worried about hedging, nor do they have expectations that prices will drop as sharply as they did in June 2016, for example.
Here's where it gets important.
We know from past history (and our second chart) that this is a reading consistent with the possibility short-term turning points, so this tells us we immediately want to be on guard "just in case."
Start by double checking your trailing stops. There's no sense in letting a reversal catch you by surprise, especially since the put/call ratio has told you that this is a possibility for the better part of a month in advance.
Consider rebalancing at the same time because that's a great way to use otherwise dull market conditions to shed risk.
And if you're an aggressive trading or investor, get ready to buy. Readings like this typically fly under the radar of most investors, so they're not paying attention, which means you can frequently swoop in and pick up what they're in an emotional rush to sell.
Again, this is not a case of wait till it happens.
Rather, the put/call ratio is an "ahead of time" indicator, which means there is an opportunity to calmly and profitably pick your path to profits even as others are asleep at the proverbial switch.
I've used the same sort of analysis on individual stocks recently in High Velocity Profits recently to show my readers more than 20 triple-digit winners year to date. But this rally is only just beginning, and my premium research can tell which stocks are going up in price right now...
I tested it against thousands of stocks spanning the last 16 years, and in just the last week, I used it to show my readers 417.24% winning gains.
You can learn more about the "X" here.
In closing, I am not advocating timing the markets with this type of analysis. I know it seems that way, but what I'm talking about is something far more subtle - learning how to anticipate changes.
I'm simply using a technical measure of market internals to judge the emotional state of the markets because doing so puts my money in sync with how people are feeling. And that, in turn, allows me to make better buy/sell decisions.
If the "herd" is almost always wrong, understanding sentiment will help you be right...
...and, hopefully, very profitable.
The key to making huge profits is finding "must-have" companies that fall into Keith Fitz-Gerald's "Unstoppable Trends" – six powerful trends backed by trillions of dollars that Washington cannot derail, the Fed cannot meddle with, and Wall Street cannot hijack. Any investor can use this strategy to beat the market, especially with Keith showing the way. Just click here to get his Total Wealth research, including all of his trends, tactics, and wealth-building reports. It's absolutely free.
The post Use This Tool and Never be Surprised by a Correction Again appeared first on Total Wealth.
About the Author
Keith is a seasoned market analyst and professional trader with more than 37 years of global experience. He is one of very few experts to correctly see both the dot.bomb crisis and the ongoing financial crisis coming ahead of time - and one of even fewer to help millions of investors around the world successfully navigate them both. Forbes hailed him as a "Market Visionary." He is a regular on FOX Business News and Yahoo! Finance, and his observations have been featured in Bloomberg, The Wall Street Journal, WIRED, and MarketWatch. Keith previously led The Money Map Report, Money Map's flagship newsletter, as Chief Investment Strategist, from 20007 to 2020. Keith holds a BS in management and finance from Skidmore College and an MS in international finance (with a focus on Japanese business science) from Chaminade University. He regularly travels the world in search of investment opportunities others don't yet see or understand.