


Things that'll be "different this time" usually aren't, especially when it comes to hot stoves, hot steering wheels, and hot bond markets. Touch 'em and you'll get burned, or so goes the thinking.
Every once in a while, though, the situation plays out.
Take the inverted yield curve that caused last Friday's vicious selloff and made countless headlines around the world when it happened for the first time since 2007.
Contrary to what Wall Street and legions of economists want you to believe, it may NOT be the harbinger of doom that it's been for the past 50 years.
Here's my case (and what to buy if you're interested in big profits).
An Outdated Predictor
First, let's set the stage.
If you've never heard of an "inverted yield curve" or you're uncertain exactly what one is, you're not alone. In fact, I know a lot of professionals who can't explain yield curves properly.
What you need to understand is actually pretty simple.
The "yield curve" is a very specialized economic indicator based on the comparison between short-term risks and longer-term risks, as reflected by the rates of return associated with them over time.
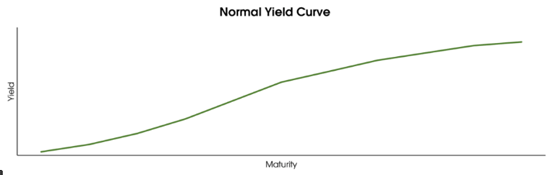
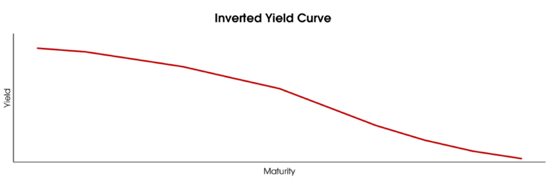
Normally, there's an upward slope because longer-term investments are riskier than shorter-term investments, because of the time involved so your required rate of return is higher. But every once in a while, the curve "inverts" - meaning that short-term risks become higher than longer-term risks.
When that happens like it did last Friday, the "curve" goes from this...
To this...
Now, here's the part that will get me uninvited from every Wall Street cocktail party for the next 200 years... yield curves have zero predictive capacity whatsoever.
Financial heresy?
Not really. Yield curves simply show you what the market thinks about how inflation is being managed and where interest rates are headed.
Free Book: Discover 61 ways to potentially triple or quadruple your monthly income. To learn how to claim your copy of “The Book of Crazy Big Income” at no cost, click here now…
The other thing to think about is that there are lots of curves, not just one. So blanket statements like there's been "an inverted yield curve today" really don't amount to a hill of beans.
For instance, you can construct a yield curve of 3-month treasury bills and 10-year notes, or 10-year notes and 30-year notes. You can even construct cross-currency curves to compare rates in different countries or regions as a means of assessing economic prospects around the world
The most popular curve - and the most widely reported - is the 2-year versus 10-year which hasn't yet inverted but is very close, as I type. Last week's inversion, in fact, was actually between the 3-month rates and 10-year yields.
What does that tell you?
Again, not much.
It's circumstantial evidence at best. If anything, the yield curve is merely flattening and - ta da - the markets can have plenty of positive performance with a "flat" yield curve - meaning long and short term rates are nearly equal.
Which brings me back to where we started.
Now, Why You SHOULDN'T Worry About The Inverted Yield Curve
[mmpazkzone name="in-story" network="9794" site="307044" id="137008" type="4"]
There are three reasons why I think the inverted yield curve really will be different this time:
- Short-term rates were held so low by a clueless Fed that they don't have far to rise to overcome long-term rates.
- The economy that has driven this indicator to unprecedented reliability over the past 50 years doesn't exist anymore. In today's markets, leverage drives what's actually happening and that, in turn, doesn't create the pronounced difference between short-term and long-term rates like it used to.
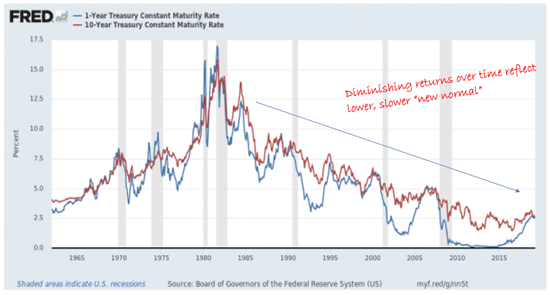
- The rapid growth in capital despite a slowing economy creates a diminishing return cycle for both long and short-term rates that you can see very clearly in the Fed's own data. It's a variation of the Law of Diminishing Returns.
This time around, the inverted yield curve that everybody thinks is such a big deal isn't... a big deal. Rather, it's nothing more than the ghost of bad Fed policy decisions, thanks in good measure, to the amount of money sloshing around at every level in our financial system.
The other thing to think about is that inverted yield curves do not mean a recession is imminent. In fact, there have been plenty of times where the yield curve has "flattened," then taken a year or more to invert after hitting 0.5%.
Here's a chart from LPL Financial that makes this point nicely.
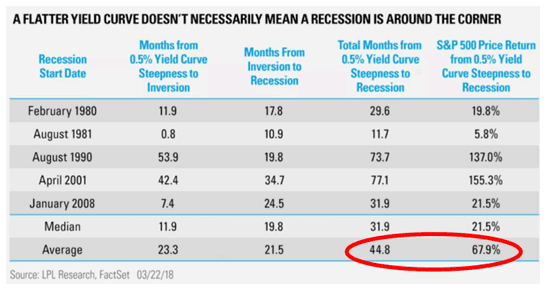
Pay particular attention to the two numbers I've highlighted at the bottom right.
That's the length of time in months - 44.8 or nearly 4 years - from 0.5% yield curve to recession and the average return of the S&P 500 from the same point until a recession actually rears its head - some 67.9%.
The question you need to ask yourself if you're tempted to run for the hills because of the headlines surrounding last Friday's inverted yield curve is... can you really sit on the sidelines, possibly as long as another 4+ years knowing the S&P 500 could still rack up nearly 70% in gains you will miss if you go to the sidelines?
My hat's off to you if you can but, frankly, I don't know of very many investors who can throw away that kind of profit potential.
Especially when you could do even better.
My team and I regularly identify companies with the potential to beat the markets 2, 3, 5 even 10 to 1.
Our sister services are chock full of plays from Insperity Inc. (NSYSE: NSP), VMWare Inc. (NYSE: VMW), and Biogen Inc. (NasdaqGS: BIIB) that given readers following along as directed the opportunity to bag returns of 247.69%, 262.90%, and even 300.00% that would have turned every $10,000 invested into $24,769, $29,820 or even $30,000 (excluding fees and commissions).
In many cases, a whole lot more.
Learn more by clicking here.
The post Things Really Could Be Different This Time appeared first on Total Wealth.
About the Author
Keith is a seasoned market analyst and professional trader with more than 37 years of global experience. He is one of very few experts to correctly see both the dot.bomb crisis and the ongoing financial crisis coming ahead of time - and one of even fewer to help millions of investors around the world successfully navigate them both. Forbes hailed him as a "Market Visionary." He is a regular on FOX Business News and Yahoo! Finance, and his observations have been featured in Bloomberg, The Wall Street Journal, WIRED, and MarketWatch. Keith previously led The Money Map Report, Money Map's flagship newsletter, as Chief Investment Strategist, from 20007 to 2020. Keith holds a BS in management and finance from Skidmore College and an MS in international finance (with a focus on Japanese business science) from Chaminade University. He regularly travels the world in search of investment opportunities others don't yet see or understand.