Sorry, no content matched your criteria.
Featured Story
How Stocks Do in September
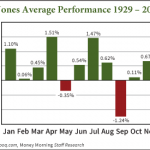
These two charts show you how stocks do in September, with the rumblings of how this is the worst month for stocks...
True, September has been the nastiest month for the Dow Jones over the last century, with an average loss of 0.8%. Since 1929, the Dow average performance for September has been a 1.24% loss.
But you can be prepared no matter what happens – and here’s how…