Sorry, no content matched your criteria.
Featured Story
This Crude Oil Price Chart Shows Where Futures Will Go in 2015
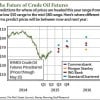
Oil prices have had a tumultuous week - but the volatility is only short term.
As this crude oil price chart shows, all major banks see prices rebounding. Some see oil surging to the mid-$70 range by Q4.
Here's where Morgan Stanley, Commerzbank, and others see WTI prices by the end of the year...
Oil prices have had a tumultuous week - but the volatility is only short term.
As this crude oil price chart shows, all major banks see prices rebounding. Some see oil surging to the mid-$70 range by Q4.
Here's where Morgan Stanley, Commerzbank, and others see WTI prices by the end of the year...