#
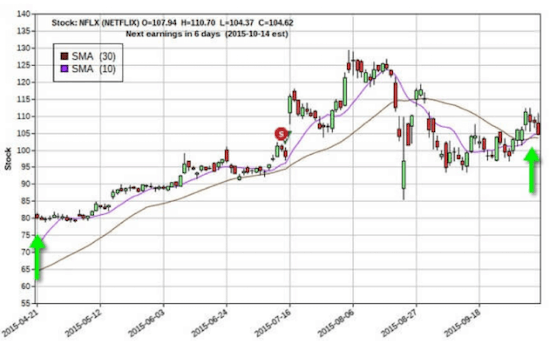
10/30 SMA Cross Over – When the 10-day simple moving average (SMA) line crosses the 30-day SMA line. This is a cue to enter or exit a trade because it shows the current trend is reversing. It is also a technique for timing the market. In order for this technique to work, the following needs to be met:
- Stock must be $50 or higher
- Stock must be trading at higher than average volume
1-Day Patterns – Patterns in Japanese candlestick charts (a market-timing technique) that show a trend reversal that is one day in length. Patterns in this category include Doji, Hammer, Inverted Hammer, and Hanging Man.
2-Day Patterns – Patterns in Japanese candlestick charts that show a trend reversal that is two days in length. Patterns in this category include Bearish/Bullish Kicker, Bullish/Bearish Harami, Piercing Pattern, Dark Cloud Cover, and Bullish/Bearish Engulfing.
3-Day Patterns – Patterns in Japanese candlestick charts that show a trend reversal that is three days in length. Patterns in this category include Morning Star and Evening Star Reversal.
A
All or None Options – This order type makes sure you get exactly what you want. If you want 10 options contracts but the market makers can only fill eight, an all or none order will automatically cancel the trade. The trade is only fulfilled if it meets your exact specifications.
American options (most common) – Despite the name, these options have nothing to do with location and everything to do with when they can be exercised. American options can be exercised at any time between the date of purchase and the expiration date. See European Options for its counterpart.
Annualized Return – A technique to standardize your returns on trades of varying lengths in order to compare how profitable they were. Here’s how to calculate an annualized return for options:
- Calculate the return by dividing the option profits by the strike price
- Divide the return by the holding period (in months)
- Multiply by 12 to get the one-year annualized return
Ask – The last price offered by a market maker to sell a particular option (you buy a security at this price).
At-the-Money – this is when the strike price of the option is the same price as the underlying security. The underlying is rarely exactly the same price, so generally options are either out-of-the-money or in-the-money.
B
Back Spread – This is when you hold more long positions than short positions of an option. The short positions help to offset the cost of the long positions. Also known as a Reverse Ratio Spread.
Bear Call Spread – To execute this strategy, you sell a call at one strike price and buy a call at a higher strike price. Both options have the same expiration date. This is a bet on a small downward price movement of the underlying. If done correctly, you should have a small credit in your account, which is why it is also known as a Credit Spread.
Bear Market – Is characterized by dropping stock prices. Often the broad market indexes need to drop for a few days in a row to be considered a bear market, with a 20% pullback from the market high. See Bull Market.
Bear Put Spread – Is when you purchase a put at a lower strike price and sell one at a higher strike price with the same expiration. It is a bet on a small upward movement in the price of the underlying security. Also known as a Put Option Strategy.
Bear Spread – Options strategy used to profit while the underlying security drops in price.
Bearish Divergence - When the underlying asset makes a higher high and the relative strength index makes a lower high. This is a method used to time the market.
Bearish Engulfing – A 2-day pattern of Japanese candlestick charts showing a downward trend that is used to time the market.
Bearish Failure Swing - When the relative strength index comes out of the overbought zone by falling below the 80 line. From there, it retraces back to and holds at or below the 80 line and then fails to reach the same level that it did before and turns upward again.
Bearish Harami – A 2-day pattern of Japanese candlestick charts showing a downward trend. It is used to time the market.
Bearish Kicker – A 2-day pattern of Japanese candlestick charts showing a downward trend. It is used to time the market.
Bid – Latest price offered by a market maker to buy a particular option (you sell at this price).
Bollinger Bands – Are a measure of relative highs and lows of a stock’s investor confidence. They are used to time the stock market.
Breakdown – When a stock that has been trading in a normal range starts to trade lower than that normal range. It is part of support and resistance in timing the market.
Breakout – When a stock that has been trading in a normal range starts to trade higher than the normal range. It is part of support and resistance timing the market.
Bull Call Spread – When you buy a call option at one strike price and sell another call with a higher strike price and the same expiration date. This is betting on the price of the underlying to increase. Also known as a Loophole, Call Debit Spread, and Vertical Spread.
Bull Market – Is characterized by rising prices on the stock market. Often the broad market indexes need to rise for a few days in a row to be considered a bull market. See Bear Market.
Bull Put Spread – When you purchase a put at a lower strike price and sell one at a higher strike price with the same expiration. This is a bet on a small upward movement in the price of the underlying security. Also known as a Put Option Spread.
Bull Spread – An options strategy used to profit while the underlying security rises in price.
Bullish Divergence – When the underlying asset makes a lower low and the relative strength index makes a higher low.
Bullish Engulfing – A 2-day pattern of Japanese candlestick charts showing an upward trend. It is used to time the market.
Bullish Failure Swing – When the relative strength index comes out of the oversold zone by rising above the 30 line. It then retraces back to and holds at or above the 30 line and then fails to reach the same level that it did before and turns down again.
Bullish Harami – A 2-day pattern of Japanese candlestick charts showing an upward trend. It is used to time the market.
Bullish Kicker – A 2-day pattern of Japanese candlestick charts showing an upward trend. It is used to time the market.
Butterfly Spread – A spread that combines a bull spread and a bear spread. It is best used when the markets are flat.
Buy and Hold – An investment strategy where you buy a security and hold it until it appreciates.
Buyer of Options – Called holders, they are not obligated to buy or sell the underlying security. They are buying the right to buy or sell the underlying security at a certain strike price.
Buy to Close – When you short an option, you sell it first. In order to close (or get out of) your trade, you need to buy the option.
Buy to Open – When you buy an option to open (or get into) a trade position.
C
Call – Gives the holder the right to buy an asset at a certain price within a specific period of time. Similar to a long position (buying a security).
Call Debit Spread – When you buy a call option at one strike price and sell another call with a higher strike price and the same expiration date. This options strategy is betting on the price of underlying to increase. Also known as a Loophole, Bull Call Spread, and Vertical Spread.
Calendar Spread – Buying a longer-term option and selling a shorter-term option with the same strike price. Both options must be the same type. They must both be puts or calls. Also known as a Horizontal Spread.
Candle Body – The open and close price that forms the rectangle on a Japanese candlestick chart (see image to the right).
Candle Shadows – The lines below the candle body on a Japanese candlestick chart (see image to the right).
Candle Wicks – The lines above the candle body on a Japanese candlestick chart (see image above).
Candlestick Patterns – Patterns that form a trend type visible on a Japanese candlestick chart.
Channel – The range a stock is trading. The channel is formed by the blue lines on the graph to the right.
Channel Reliability – How well-established the trading channel is. The more times a stock price hits the upper and/or lower limit and bounces back into the channel, the more reliable the channel. The channel on the graph to the right is well-defined since the price has hit the upper and lower limit several times and remained in the channel.
Chicago Board Options Exchange (CBOE) – The exchange where options are traded.
Closing Your Position – When you sell-to-close or buy-to-close your option to get out of a trade.
Collar – An options trade that has three components. Those components are:
- Owning 100 shares of the underlying security
- Buying a long put that is at or slightly out-of-the-money
- Selling a call that is slightly out-of-the-money
Consolidation Pattern – When the stock price fluctuates between support and resistance for a period before one group, either buyers or sellers, wins out and the price of the stock either rises or falls.
Contingent Order – An order that is not sent to market until a certain contingency is met. An example of a contingent order is one saying to buy a specific stock when it hits $4 or better.
Continuation Candlestick Pattern – Signals a continuation of the existing trend in Japanese candlestick charts.
Covered Call – When you own shares of a company and sell calls of that same underlying security. It is a low-risk way to make money from options trading.
Credit Spread – When you sell a call at one strike price and buy a call at a higher strike price. Both options have the same expiration date. This is a bet on a small downward price movement of the underlying. Also known as a Bear Call Spread.
D
Dark Cloud Cover – A 2-day pattern in Japanese candlestick charts.
Death Cross – Formed when the 50-day simple moving average crosses below the 200-day simple moving average. This signal is used to time the market.
Delta – The ratio that compares the change in the price of the underlying asset and the corresponding change in price of the options contract. It ranges from 0 to 100 for calls and 0 to -100 for puts. As delta approaches 100, the option’s price acts more like the underlying stock. The more in-the-money a position is, the closer to 100 delta will be.
Diagonal Spread – When you buy or sell either calls or puts with different strike prices and different expirations.
Directional Trade – An options trade that requires the underlying security to move a particular way – either up or down – to be profitable.
Discretionary Trader – Uses a mix of rules and subjective input to make buy and sell decisions.
Doji – A 1-day pattern in Japanese candlestick charts.
E
Earnings Reports – A report released by publicly traded companies every quarter telling important financial information such as revenue, expenses, and how much the company made.
Economic Cycles – The normal and somewhat predictable upward and downward movements of the economy as a whole.
European Options – Options that can only be exercised at the end of their lives. The name is deceiving because it does not matter where the option is traded. What matters is when you can exercise your contract. See American Options.
Evening Star Reversal – A 3-day pattern in Japanese candlestick charts.
Exercise – When you use your option to buy (call) or sell (put) the underlying at the strike price before the expiration date.
Expansion – A term used with Bollinger Bands. It is a pattern that forms when a stock starts to break out of it previous trading pattern. Bollinger Bands are a technique used to time the market.
Expiration Date – The third Saturday of the expiration month in options. The last trading day is usually the third Friday of the month, unless it is a holiday.
Exponential Moving Average – Similar to the simple moving average. The difference is that more weight is given to more recent data in exponential moving averages.
Extrinsic Value – Part of the option premium that represents time and the momentum of the underlying security. Also known as Implied Volatility.
F
Failure Swings – When a stock starts to swing back the way it came and then continues either its upward or downward momentum. See the chart below for a full explanation.
Fibonacci Retracement Ratios – Ratios that show the likelihood a stock will reach a certain level. They are used for timing the market.
Fill or Kill (FOK) Options – Fills the order immediately or not at all, so you don’t risk leaving open options orders on the market.
G
Gamma – Measures how much an option’s delta will gain or lose if the underlying stock rises by one full point.
Good Til’ Canceled (GTC) Orders – Usually placed on stop limits or trades that you are speculating about (i.e., a particular option is trading at $1.75, but you put an order in to buy that option at $1.50 because you are hoping the price will drop). This keeps your order open until you tell your broker to cancel the order.
H
Hammer – A 1-day pattern in Japanese candlestick charts
Hanging Man – A 1-day pattern in Japanese candlestick charts
Hedge – Is kind of like an insurance policy. It helps protect you from losses.
Horizontal Spread – Created by buying a longer-term option and selling a shorter-term option with the same strike price. Must both be puts or both calls. Also known as a Calendar Spread.
I
Implied Volatility – The level of expected future volatility based on the current price of the option and other known pricing variables.
In-the-Money – When your option strike is better than the prevailing market price. This means the market price is higher than the strike price for a call, or lower than the strike price for a put.
Insurance Puts – Long puts you buy to protect a stock or ETF from a potential drop in price. Also known as a Married Put.
Intrinsic Value – The amount an option is in-the-money.
Iron Condor – A non-directional options trading strategy. It is best used when you believe the underlying security will remain at about the same price. An iron condor consists of:
- A bull put spread
- A bear call spread
J
Japanese Candlestick Charts – A market-timing technique that puts the daily high, low, open, and close price on a chart. These data points look like a candle. You compare the “candles” to detect trends.
L
Limit Orders – Used when you place a market order to limit your losses. It instructs your broker to buy or sell a security at a certain price or better.
Long Calls – When you buy a call option.
Long Puts – When you buy a put option.
Long-Term Equity Anticipation Securities (LEAPS) – Long-term options that don’t expire for three years.
Loophole – When you buy a call option at one strike price and sell another call with a higher strike price and the same expiration date. This options strategy is betting on the price of underlying to increase. Also known as a Call Debit Spread, Bull Call Spread, and Vertical Spread.
M
Market-on-Close (MOC) Orders – An order that is executed as close to the end of the trading day as possible.
Married Put – When you buy puts to protect a stock or ETF from a potential drop in price. Also known as an Insurance Put.
Max Loss – The maximum amount you can lose on a trade.
Morning Star Reversal Pattern – A 3-day pattern in Japanese candlestick charts.
Moving Average Convergence Divergence (MACD) – A momentum indicator that measures the strength and duration of a trend.
N
Naked Options – Options where you are required to buy or sell the underlying security and you do not own the security, nor do you have an option to allow you to buy or sell the option at a more favorable price.
Non-Directional Trade – When you combine options in a way that you don’t need to worry about the direction the underlying security moves. As long as the underlying moves, you will make money with these types of trades.
O
Open Interest – The total number of contracts of a particular option that have been opened but have not yet been offset by the market makers.
Open Positions – Any open trade that has not yet been closed with an opposing trade, i.e., a buy position that has not been matched with a sell position of the same type.
OpSym (Options Symbol) – Consists of the stock symbol of the underlying security, contract month and year, strike price, and whether the option is a call or put (c or p).
Option – A contract that gives the buyer the right to buy or sell an underlying asset at a specific price on or before a certain date. The contract does not obligate you to buy the underlying asset.
Options Account – The type of account needed to be able to trade options.
Options Listings – A table that tells you all of the relevant information about an option you can buy or sell.
One-Cancels-Other (OCO) Order – A pair of orders stipulating that if one order is executed, then the other order is automatically canceled, usually it is a stop order combined with a limit order.
Order Types – Instructions sent to your broker about entering or exiting a position. One-cancels-other is an example of an order type.
Out-of-the-Money – When the strike price is above the market price for a call or below the market price for a put.
Overbought – When too many people have purchased a particular security and the security is now overpriced.
Oversold – When too many people have sold a particular security and the security is now underpriced.
P
Pennant Pattern – A pattern that forms on stock charts that is used to time the market. Also known as a Triangle Pattern or Wedge Pattern.
Percent to Double – The percent move the underlying asset needs to move for you to double your money on a particular options trade.
Piercing Pattern – A 2-day pattern used in Japanese candlestick charts for timing the market.
Pivot Point – The average of the high, low, and closing prices from the previous trading day. It is a method used to time the market.
Plain Vanilla – Basic options.
Premium – The total cost of an option.
Put – Gives the holder the right to sell an asset at a certain price within a specific period of time.
Put Options Spread – When you purchase a put at a lower strike price and sell one at a higher strike price with the same expiration. It is a bet on a small upward movement in the price of the underlying security. Also known as a Bull Put Spread.
R
Ratio Spread – When you sell more calls than you have covered by stock. For example, if you own 300 shares of stock and you sell four calls.
Relative Strength Index (RSI) – Computes the momentum of a trend by looking at the ratio of higher closing prices to lower closing prices. This strategy is used in timing the markets and is best used in sideways (horizontal) trends.
Resistance – The price or range at which a stock resists going any higher in price. It is used in timing the market.
Reverse Calendar Spread – When the short position expires after the long position. See Calendar Spread.
Reverse Candlestick Pattern – A signal of a price reversal. It is used in Japanese candlestick charts to time the market.
Reverse Ratio Spread – When you sell one call backed by 100 shares of stock and buy a higher-strike call at the same time. Also known as a Back Spread.
Reverse Spread – Any spread set up opposite of its better-known version.
Risk – The potential for loss associated with an investment.
Risk Graph – A graph showing your potential gains versus potential losses if a stock moves in a particular direction.
Risk Management – Any strategy used to manage or limit your exposure to risk in investing.
Rolling Forward – When you close a current position and replace it with a later-expiring new position.
Rules-Based Trader – This type of trader sets and adheres to rules about how they will trade. Rules include when they will enter and exit a trade and how they determine what a good trade looks like.
S
Seller of Options – Called writers, they are obligated to buy or sell the underlying security of an option if it is exercised.
Sell to Close – When you sell an option to close out your position. You will be neither long nor short the option after your sell to close is executed.
Sell to Open – When you sell an option to open a position. You will be short the option after the order is executed. In order to close your position, you will need to buy to close the option.
Short Calls – Calls you sell without owning the call contract.
Short Covered Calls – Calls you sell without the call contract but that are backed by owning the underlying asset.
Short Puts – Puts you sell without owning the put contract.
Short Spread – When you sell both a call and a put of the same expiration but different strike prices. See Spread.
Short Straddle – When you sell both a call and a put. See Straddle.
Simple Moving Average (SMA) – Calculated by adding the closing price of the security for a number of time periods and then dividing the total by the number of time periods. For example, the 20-day simple moving average is calculated by adding up the closing price for the last 20 days and dividing that number by 20.
Strike Price – The price at which an underlying stock can be purchased (call) or sold (put) with an options contract. The price a stock must go above (for calls) or below (for puts) the strike price before a position can be exercised (put into effect) to make a profit.
Speculation – Betting on the movement of a security.
Spread – An option position where you buy and sell an equal number of options on the same underlying but with different strikes or expirations.
Squeeze – When a stock is in a flat period of trading and the outer bands of a Bollinger Bands model pinch together. This technique is used in timing the market.
Statistical Volatility – The measure of volatility of the underlying asset derived by the price movements of the underlying.
Stochastics – A momentum indicator used to measure a stock’s closing price compared to its price range over a specific period of time. It is a technique for timing the market.
Stop-Limit Order – An order type that combines a stop order with a limit order.
Stop Order – An order sent to your broker to buy or sell a security once the price reaches a specific price or better.
Strangle – When a call and put are bought with the same expiration date but different strike prices.
Straddle – When you are either long a call and a put or short a call and a put with the same strike price and expiration price.
Support – The price or range at which a stock is supported from trading any lower in price. It is used in timing the market.
Synthetic Stock Position – When you buy at-the-money calls and sell an equal number of at-the-money puts.
T
Time Spread – When you buy options that have the same strike but different expiration dates. Both options must be the same type: either both calls or both puts. Also known as a Calendar Spread.
Time Value – The amount of an option’s premium associated with the amount of time remaining until expiration.
Timing the Market – An effort to enter the market at the bottom point of a dip and exit the market at the peak of a rise to maximize short-term profits.
Theta – How much value an option will lose with the passage of one day’s time.
Trading Slump – When two or more trades in a row result in a loss.
Triangle Pattern – A pattern that forms on stock charts. It is used to time the market. Also known as a Pennant Pattern and Wedge Pattern.
U
Uncovered Calls – Options where you are required to buy or sell the underlying security and you do not own it, nor do you have an option to allow you to buy or sell the underlying asset at a more favorable price.
Underlying Security – The 100 shares of the specific stock, index, or fund the option controls. Also known as the underlying or underlying asset.
V
Vega – The amount by which the price of the option would be expected to rise or fall based solely on a one-point increase in implied volatility.
Vertical Spread – When you buy a call option at one strike price and sell another call with a higher strike price and the same expiration date. It is betting on the price of underlying to increase. Also known as a Loophole, Call Debit Spread, and Bull Call Spread.
Volume – How many contracts of a particular option were traded during the latest session.
W
Walking the Bands – When a stock trades high or low on Bollinger Bands themselves. This indicator is used to time the market.
Wedge Pattern – A pattern that forms on a stock graph that is used to time the market.

