

A picture is worth 1,000 words. But some pictures are worth actual money.
Today, we're going to show you how to use a chart for a profitable options strategy.
In fact, a simple chart of a stock's performance is an incredibly valuable picture. It can directly inform your options trading decisions - and potentially double your investment. That makes it the most important aspect of investing.
It shows you at a glance whether the stock is in a bull market or a bear market. And it can give you reference for what the market considers cheap or expensive.
 Let's say you bought a tech stock near the end of the Internet bubble in the year 2000. You watched it gain in price. Then, after the bubble popped, you watched it fall back to the same price at which you bought it.
Same price, different trend. But when you bought it, it was in a bull market. That was not true on the way down.
You can spot trends like this by simply glancing at a chart. But you can take your money even further with a few tricks from experienced traders.
Here's how a professional trader uses charts - and how you can do the same to profit in the triple digits trading options.
How the Pros Find Trends
Professional investors use technical tools to quantify the trend. For long-term investing, they look at the 200-day moving average, which smooths out the daily wiggles over a period of 200 days. It adds up the last 200 closes and divides by 200.
Simple. If the average is rising, then the long-term trend is bullish.
For intermediate-term investing, they look at the 50-day average. This is arguably the most important tool for many investors. However, in the choppy environment we now see thanks to on-again off-again trade talks, politics, and interest rates, we have to play it a little closer to the vest.
Learn How to Trade Like the Pros: Tom Gentile just recorded all of his most potentially lucrative trading secrets in America's No. 1 Pattern Trader Cash Course. This could set you up for life - and it'll only cost you $1...
Money Morning Quantitative Specialist Chris Johnson says that the 20-day average is the right tool for the market today. He buys when the stock price crosses above its 20-day average and sells when it falls back below. But he knows that just trading off a single average can cause false signals. Therefore, for "buy" signals, he looks to the next level and requires the stock to also have a rising 50-day average. And for short sells, he looks for the 50-day average to be falling.
Now, here's our chart today - and an options trading strategy where you can put these indicators to use.
The Options Strategy That Can Double Your Money
[mmpazkzone name="in-story" network="9794" site="307044" id="137008" type="4"]Charts and indicators are great, but you want to know if this strategy works. Well, it does!
Chris published a story here on Money Morning on Sept. 26 demonstrating the concept with a trade made two days earlier using options on HP Inc. (NYSE: HPQ).
At that time, the stock had just moved below its 20-day average, and the 50-day average was also trending lower. It was the perfect setup for a bearish trade.
That day, the stock closed at $18.15.
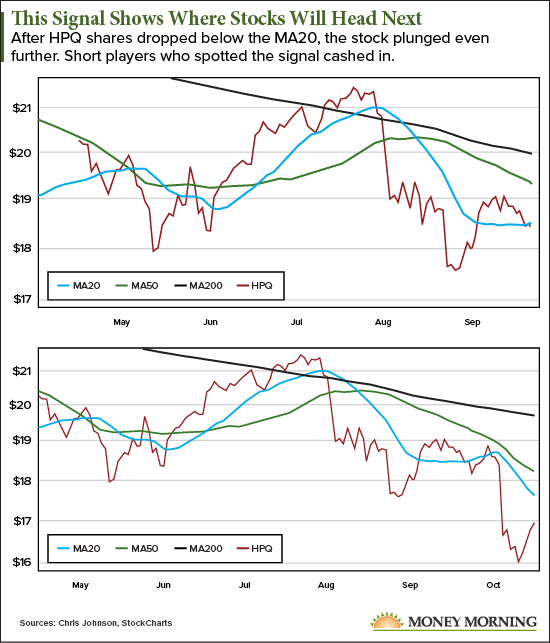
Chris bought the HPQ Oct. 18, 2019 $19 put (HPQ191018P00019000), which closed that day at $1, because he had a short-term downside target of $17. Success here would have delivered a 100% gain on the option.
Within days, HPQ stock began to fall again. The price of the option soared to $2.45 on Oct. 4 as the stock jumped down to Chris' target price. As predicted, he got his triple-digit gain, this time of 145%.
But it did not stop there, as the stock dipped down to $15.93 and the put price rallied up to $3 for a 200% gain on Oct. 10.
You see how this trade can work quickly and is very easy to identify. Just remember, this is a short-term strategy used to make money in choppy markets, such as the one we see today.
Get Access to America's No. 1 Pattern Trader Cash Course (for Just $1)
Tom Gentile's seven-day Cash Course covers all the essential trading ideas you need to know to get the most out of your potential profits in 2019.
And not only will Tom review the basics, he'll share dozens of his most lucrative secrets to potentially start collecting anywhere from $1,190, $1,313, and even $2,830 in consistent income - each and every week.
All of this and more can be yours for only $1.