While everyone's been talking about the Dow's third major milestone this year - breaking the 24,000 mark - I'm focusing on something else...
You see, there's a new technical pattern forming in a couple of department store stocks. If it's true and you catch it at the right time, you can make a lot of money.
But timing is everything because this pattern is a tricky one.
Make sure your kids aren't looking over your shoulder trying to read this educational piece. If you are the squeamish type, you may not be able to get through this article in one reading. I'm going to teach you a new technical pattern with a not-so-happy name.
Let's examine the profit potential of this macabre-sounding pattern that may be taking place on a couple of department store stocks...
The Dead Cat Bounce
The pattern gets its name from an old saying among traders that "even a dead cat will bounce if dropped from a high enough level."
And the same for goes for stocks. Well, it goes for stocks when you're interested in a short-term recovery-type trade, which is great for a quick profit.
Free Book: The secrets in this book helped one Money Morning reader make a $185,253 profit in just eight days. Learn how to claim your copy here…
A dead cat bounce (DCB) is the type of pattern that usually forms after a sustained drop in share price, let's say six months to a year. At that point, the stock may become a turnaround candidate with the potential to be a nice performer over the long haul. But that's just potential...
The stock being observed is still one that had a significant drop in share price over a long period of time.
These stocks are generally trading at or near a year's low in price, so to expect them to just bounce back to previous all-time highs or start making new highs is actually not that realistic.
The term "bounce" in the name of the strategy signifies to me this will be a somewhat sharp or quick upward move. After a stock soars again, it's not uncommon for it to fall back to Earth. In fact, it's generally likely.
It may bounce a few times at this low and start hammering a lengthier bottoming-type technical setup like a double or triple bottom, a rounding bottom, or a cup-and-handle pattern.
But it first has to bounce, and the dead cat bounce is the first pattern to watch for when stocks are at significant lows. We use it to profit from the short-term recovery of a falling stock.
A Look at Macy's

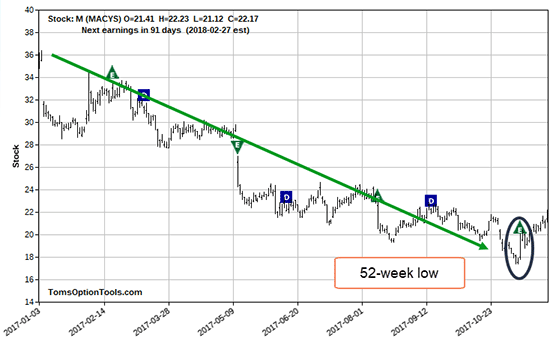
The "E" I circled indicates Macy's Inc.'s (NYSE: M) most recent earnings report.
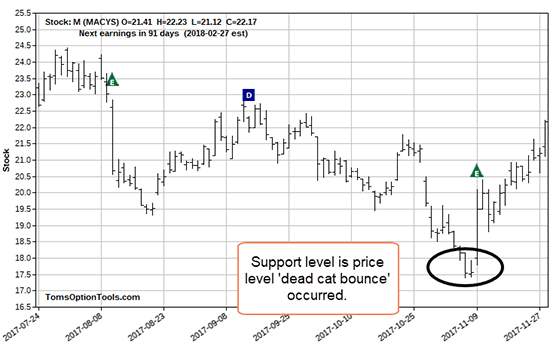
M stock dropped after all the previous earnings reports on the chart. Yet the stock recently bounced after its 52-week low. The previous post-earnings downward trend makes it hard to know if the latest report factored into the bounce.
Look at what my tools show as the percentage move of the stock after the last few earnings reports:

The most recent percentage move is on the left. It was better than the two preceding earnings reports. In the chart, you can also see how the stock moved over the last three earnings reports.
Earnings Whisper shows that Macy's earnings came in better than expected at $0.23 per share versus estimates of $0.19 per share. Revenue met expectations at $5.3 billion.
The report from the earnings website also stated Macy's expects fiscal-year earnings between $2.91 and $3.16 per share, excluding items compared to the company's previous guidance between $2.90 and $3.15 per share.
Based upon the action in the share price, we see that investors considered it favorable news. Even Jim Cramer on CNBC called M a buy at the time.
The Cause for Concern with This Pattern
Most of the time, we only notice the dead cat bounce after it has already happened...
[mmpazkzone name="in-story" network="9794" site="307044" id="137008" type="4"]

Around earnings reports, I encourage you to watch the price action for a stock at a 52-week low or near lows over a six-month period. I am not talking about looking for a straddle or strangle, but looking for a straight, long call option trade.
What I look for if I've missed the bounce (which has happened to everyone) is a retest of the price from which the stock bounced.
I look for that price to hold as a support. Since it bounced from that price once, I look for it to do so again as it will have formed a double-bottom support.
Macy's has not retraced off its DCB just yet. Time will tell if it does at all.
What I would wait for is the stock to retrace and not chase it. When it does, anticipate the stock to bounce again. The time frame for an option expiration is at least a month or so out, but not much further than that.
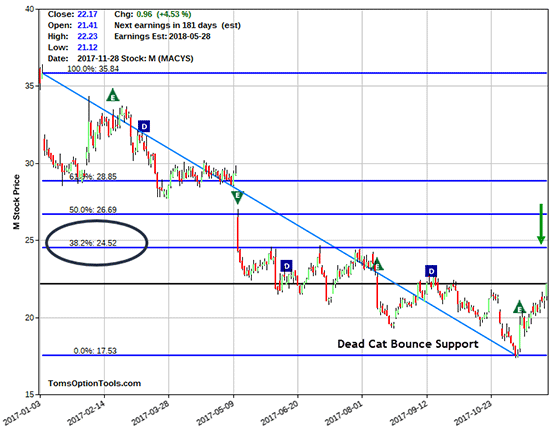
One thing you can do when projecting the price target of a bounce is to place Fibonacci retracement lines on the chart. Consider closing part or all of your positions at these Fibonacci levels.
If you want, consider taking half-profits if you get a double, then moving your stop up to break even and trail the rest to another double or higher.

The above chart shows Macy's stock price with Fibonacci retracement levels. The 38.2% retracement level would put the stock at $24.52.
An entry on the stock or buying an option right now, to me, is not a favorable reward-to-risk situation. The stock is a bit above the mid-point of the price move higher to that 38.2% Fib level. That stock is also above the support where the DCB happened. Buying now provides a less than 1:1 reward-to-risk ratio - too risky.
My stance is to wait for a retracement to the DCB support level and watch price action to see if I can gauge whether the stock will bounce again.
Another Department Store's Dead Cat Bounce
Sears Holdings Corp. (Nasdaq: SHLD) may also have experienced a dead cat bounce.
Let's take a look at my chart...

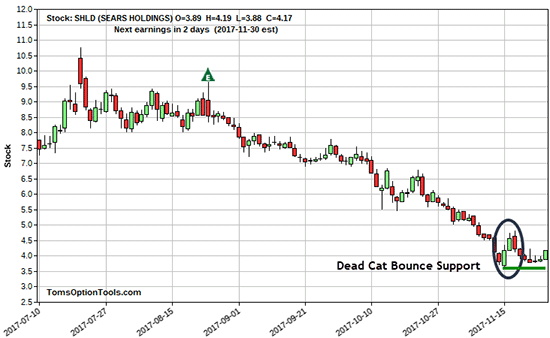
SHLD is currently at a four-month low. I chose four months so that we can see what I believe is a DCB.
SHLD bounced and has retraced to that level where it bounced from. This is price action that is bullish enough for me to see a bullish option candidate.
If you want to look into a long call a month or so out, that is up to you. The only thing that holds me back from showing you an option trade idea is that the price is too low for me to participate in.
Some of you have probably paid more for an option contract than it would cost you to buy at least 100 shares of SHLD.
If there is any bullish action on your part, I ask that you please establish a technical price support. For instance, you could choose to close below the support price level shown by the green line on the chart above.
If You Like Fast Cash, You Don't Want to Miss This
I love fast money. That's why I've been working on a new invention. It's a way to get rapid-fire profits in your hands week after week.
I'm talking about trades you can make from anywhere, even right on your phone, in four days or less.
The pattern behind these quick paydays appears every single week. And I'm the only one who knows how to find it.
I've used it to show my readers top gains like 100% on RTN in one day, 100% on BIDU in one day, 120.93% on MS in two days, and 124% on ABBV in one day.
If you hope to find yourself with a pile of extra cash in your pockets, click here to learn more...
The post The Unprecedented Moneymaking Potential of This New Technical Pattern appeared first on Power Profit Trades.
About the Author
Tom Gentile, options trading specialist for Money Map Press, is widely known as America's No. 1 Pattern Trader thanks to his nearly 30 years of experience spotting lucrative patterns in options trading. Tom has taught over 300,000 traders his option trading secrets in a variety of settings, including seminars and workshops. He's also a bestselling author of eight books and training courses.


