


It's finally here.
That one out of four times a year that the market gets to see real numbers that actually put a valuation on the stocks that they have been buying or selling for the last three months.
Not the "Market's Value," but rather the "Real Value."
That's right, it's earnings season. And this season should be a big one for moving stocks... Why?
Since the last earnings season, investors have spent the last three months dusting themselves 0ff and getting back into stocks. That's after nine months of bear-market declines followed by six months of a tepid trading range.
But finally, after all of that, investors appear to be jumping back into the market. Is it the right time?
Let's look at the numbers for the answer...
Since the start of the last earnings season, the S&P 500 is trading 6% higher; the Nasdaq 100, 15% higher. And like the S&P 500, the Russell 2000 Index is up six percent.
All in all, that's a healthy run for the market across the board.
But a run like that comes with some risks.
Many of the indicators we traditionally monitor to determine the market's ability to move higher are flashing signs of caution.
First, a view of the sentiment picture.
About six months ago, I laid out the argument that the market was in the process of climbing a "wall of worry." This is a term used to describe the bullish conditions that exist when the market is able to continue to rally despite what appears to be a bearish backdrop.
"Wall of Worry" rallies tend to dissipate or slow as investors become less worried about the market. In other words, the moment many investors begin to expect the best case for the market.
According to several signs, we're approaching that point.
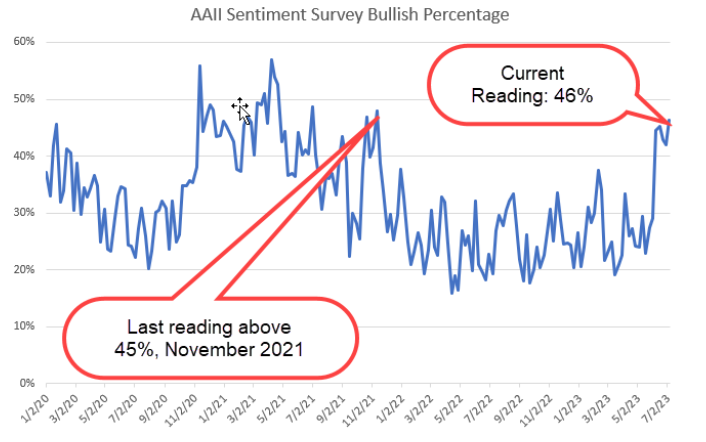
First, the AAII Sentiment Survey. This weekly survey gauges individual investors' expectations for the market. It's best known as a contrarian indicator for the same reason I described above. Market tops tend to coincide with highs in the survey's bullish responses.
The chart below shows the percentage of bullish responses to the survey since January 2020. While this percentage is not at its highs for the period, it is quickly approaching a reading of 50% or higher, which has signaled several intermediate-term tops over the last three years.
Similarly, the CNN Fear & Greed Index is at levels suggesting that the market is currently being driven by extreme levels of investor greed.
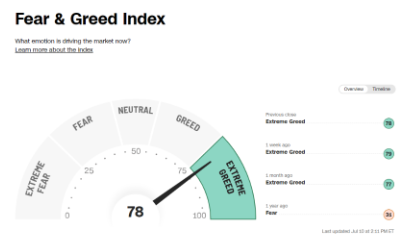
This sentiment index is data-driven by seven different data points that gauge different activities of investors' behavior.
Like the CBOE Volatility Index and the AAII Sentiment Survey, market tops are associated with "greed" or price chasing, while bottoms are most often an indicator that it's time to start buying stocks.
There are several sentiment indicators that provide the same view of the current market that can simply be stated as investors may be too optimistic based on the current market dynamics.
That said, sentiment is not enough to call a market top.
Optimistic sentiment can (and will) remain optimistic as long as market prices continue to make their way higher.
This is where a look at the market's technicals comes into play.
One of my favorite indicators to gauge the market's ability to continue higher is the percentage of companies in the S&P 500 that are trading above their 50-day moving averages.
This momentum indicator is very effective in identifying intermediate-term tops and bottoms in the market.
High readings - those more than 80% - indicate that the market is close to being "stretched" too high. Low readings - those below 20% - signal that the market is likely oversold and ready to bounce.
Current readings of this technical measure are hovering below 80%. While this doesn't mean the market is ready to shift the tide into broad market selling, it does suggest the market is near an intermediate-term top.
Zooming in a little closer on the technicals, there are two sectors I'm watching the closest: the Semiconductors and Financials. More narrowly, the regional banks.
These two groups of stocks represent the opposites of the market over the last three months and should give a good sense of the market's ability to move through the earnings season.
Both sectors have a number of companies that will report results relatively early in the season, setting the stage for the market's response for the season. But both also sit at critical technical levels.
SPDR S&P Semiconductor ETF (XSD) has rallied 14% since last quarter, putting it near the top for sector performance for the period. Investors have been shoveling semiconductor stocks like NVIDIA Corp (NVDA) and Advanced Micro Devices, Inc. (AMD) into their portfolios as they chase the rally in AI stocks.
Remember I mentioned "real value" versus the "market's value" in the opening? This is where the rubber will meet the road for the semiconductor sector, and likely the current rally.
On the other side of the coin is the SPDR S&P Regional Banking ETF (KRE).
KRE shares are trading down 1.4% since the beginning of the last earnings season. The reason is simple: There's still a lot of risks present in these stocks.
Interest rates are rising again, as the market is readjusting its expectations for interest rates to the FOMC's reality that we'll indeed see higher rates for a longer period. That combination is a certain headwind for the regional banks that will have to deal with everything from higher default rates to another round of "flight to yield," as deposit rates are dwarfed by other safe havens like treasury bonds.
Currently, the KRE sits at a critical technical level just above $40. This price represents what I call a "trap door" for the sector.
A break below the $40 level will indicate that the sector is falling back into an intermediate-term bearish trend. That move will increase selling in this key market sector and likely spread selling to the broader market.
The balance of power between these two sectors suggests the market is facing a slight headwind that will provide increased opportunities for both investors and traders.
Tomorrow, I'll dig deeper into the pre-earnings sector view for the market along with two ETFs that I am trading ahead of the season.
The post This Is the Quiet Before an Earnings Storm? appeared first on Penny Hawk.
About the Author
Chris Johnson (“CJ”), a seasoned equity and options analyst with nearly 30 years of experience, is celebrated for his quantitative expertise in quantifying investors’ sentiment to navigate Wall Street with a deeply rooted technical and contrarian trading style.