One of the biggest mistakes a trader can make is making things more complex than they need to be.
The truth is, complexity isn't a requirement to accurately predict a stock's next big move or your next big profit turner.
And today, I want to reveal my simple system that can pinpoint the next profitable opportunity with ease.
Here's what I mean...
How to Score Triple-Digit Gains Using My K.I.S.S. System
Traders and investors are always faced with the question, "Which stock do I trade?" There are a myriad of ways to answer this question. Long-term investors normally lead with fundamental analysis, letting each company's financial health determine which stocks they will buy and hold.
Traders usually lead with technical analysis, using technical indicators that generate signals today based on historical data. I've written about a lot of technical indicators, and all of them have merit. Moving Average Convergence Divergence, Relative Strength Index, Stochastics, and Bollinger Bands are a few examples of indicators that take historical data and create lines on the chart from which we can spot patterns that may result in a correct directional prediction.
All this is great, but sometimes it's best to keep it simple.
And believe me, it doesn't get much simpler than my K.I.S.S system.
Here's how it works:
On a daily basis, I scan for which stocks are making the most noise. By that I mean stocks that make the biggest percentage moves in a single day. Think of it as listening for a thunderclap and jumping on stocks that have the loudest thunderclaps.
This "noise" is actually stocks that are making the biggest one-day moves.
This makes the process much simpler, as the big movers are easy to pinpoint. No complicated technical indicators - just the biggest percentage movers.
Have 28 Seconds? You could make $2,353 - and you won't need to buy a single share of stock up front to collect this cash, or spend a nickel on anything. Click here to learn more...
The biggest moving stocks tend to keep on moving in the direction of the day. We can apply some basic technical indicators like support, resistance, volume, and moving averages to strengthen our directional prognosis.
Now, let's look at an example on Tiffany & Co. (NYSE: TIF).
[mmpazkzone name="in-story" network="9794" site="307044" id="137008" type="4"]
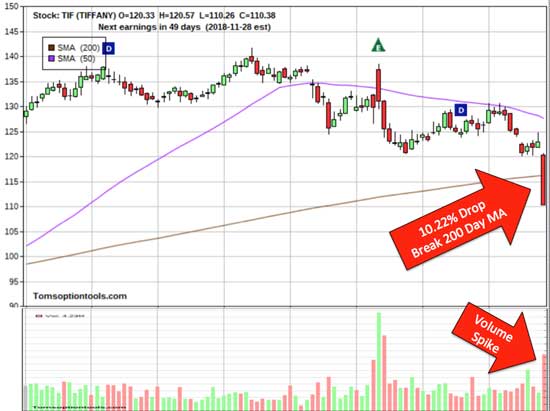
On Oct. 10, TIF came up on my radar with a thunderclap after dropping 10.22% in a single day.

What makes this 10.22% drop even more compelling is that TIF also crashed through its 200-day moving average, accompanied by a big volume spike, suggesting even more downside.
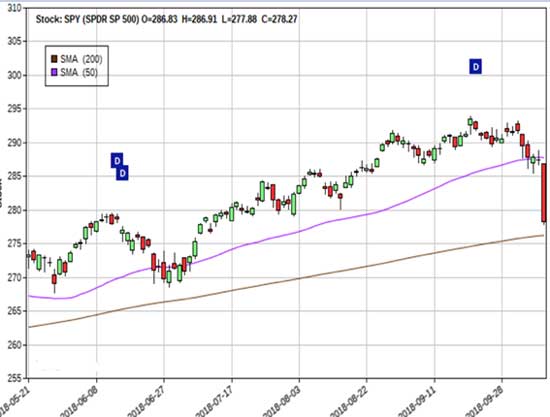
Further strengthening a bearish prognosis is that also on Oct. 10, the S&P 500 broke decisively through its 50-day MA, as you can see below:

Two months later, TIF is currently sitting on a $25 (23%) drop - with apparently more downside to go, as you can see below on the current chart:

Additionally, the 50-day MA is now firmly below the 200-day MA, confirming a continued bearish prognosis.
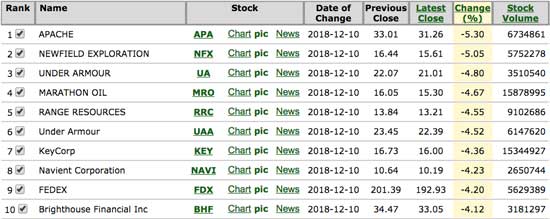
I use a scanner to find these. Here are the current biggest droppers as of the writing of this article:

Be sure to apply your favorite technical indicators as well as confirm with a market index chart like the S&P 500.
Remember, your stock analysis doesn't have to be complicated to score big profits!
In fact, it's not out of the ordinary for the so-called "complexity" of options trading to send readers to the hills...
But here at Power Profit Trades, we know better. We know it's all a ruse Wall Street puts on to keep the billions of dollars of cash at play in their hands - not yours.
But that's all changing...
New AI Is Years Ahead of Wall Street
Morgan Stanley just hired an Ivy League computer scientist to head up their new Artificial Intelligence efforts. Goldman Sachs brought in an AI expert from Amazon, and JPMorgan is getting into it as well. But try as they might, they are likely still years - even decades - behind Alpha-9. It's an unprecedented combination of raw computing power, blazing processing speed, and other-worldly intelligence... and now, you can become a millionaire in 12 months. See how right here.
The post This Simple Stock "Predictor" Can Hand You Your Next Big Winner appeared first on Power Profit Trades.
About the Author
Tom Gentile, options trading specialist for Money Map Press, is widely known as America's No. 1 Pattern Trader thanks to his nearly 30 years of experience spotting lucrative patterns in options trading. Tom has taught over 300,000 traders his option trading secrets in a variety of settings, including seminars and workshops. He's also a bestselling author of eight books and training courses.


