


Right now, volatility is the star of the financial news networks.
Now most of the pundits simply use the Chicago Board Options Exchange (CBOE) Volatility Index (VIX) - known as the "Fear Index" - to tell you where market volatility is heading from here.
Here's what they don't understand...
The VIX is not the best way to gauge the amount of fear in the markets when it comes to options trading.
It's not even a good way.
The Best Way to Measure Volatility in the Options Market
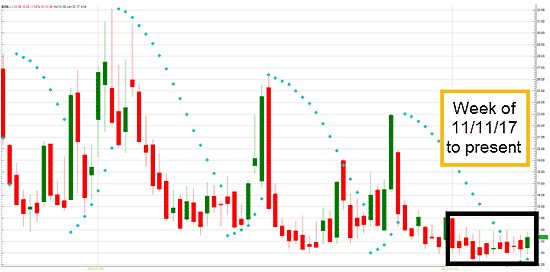
Before I reveal the ultimate tool for measuring volatility in the fastest-growing moneymaker in the world, I want to spend a little more time on the Fear Index (the VIX), which is currently trading at 13.27. The problem is the VIX can go low - and stay there - for quite a while, which doesn't really make it a useful market timing tool. The VIX has been under 15 for some time, and the markets have catapulted to all-time highs (until the recent 1% pullback in the markets this week).
When looking at a weekly chart on the VIX dating back to January 2015, you can see that the VIX has been under 15 in 32 of those 78 weeks. And when looking at a shorter-term view, say from Nov. 11, 2016, following Donald Trump's win to now - it hasn't gone above 15 once, while the markets have hit historical new highs...
This could be a bit confusing or trying for investors following waiting for the market to drop significantly based on what's supposed to be a bearish indication of market volatility.
Now if this market is at the beginning of a significant pullback (more than the 1% drop we saw this week), it may just be a pullback leading to even higher highs. But if this market does indeed have an extended drop from here, and we see a spike in the VIX up into that 20 or higher area (maybe even 30), that may signal to investors and traders that it's time to buy. As the adage goes, "when the VIX is high, it's time to buy."
Another common way the pundits measure market volatility and fear is the Barclays Bank PLC iPath S&P 500 VIX Short-Term Futures ETN (NYSE Arca: VXX). The VXX, not to be confused with the VIX, is an exchange-traded note (ETN), which is different than an exchange-traded fund (ETF). An ETF typically holds the assets it tracks (whether stocks, bonds, or other commodities) whereas an ETN acts more like an unsecured debt note. ETNs also don't buy and sell assets within the fund like an ETF does. An ETF can own the same stocks of the index it is supposed to track, but an ETN doesn't collect securities and is based on algorithms based for the S&P 500.
The tricky thing with the VXX is that it is often in "contango," which means it faces higher prices every month (since it's based on short-term VIX futures) because it needs to keep adding on the latest futures, which are usually a bit more expensive than the last one. Ongoing costs is often a negative sign for expected returns.
Take a look at the VXX's price patterns since last October...
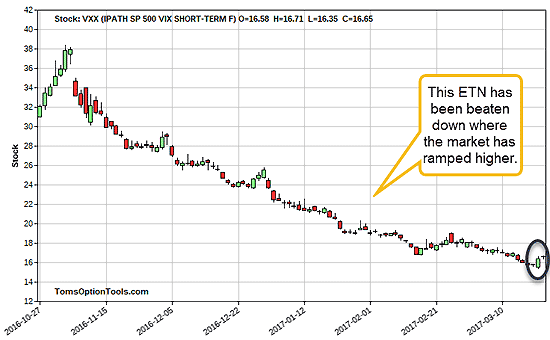
As you can see, the VXX has been sliding down in price for quite a while. In fact, it's down nearly 99% since it's inception on Jan. 29, 2009. I circled the last couple of days where it looks like there might be a bounce possibly coming, but based on its track record, I'm not confident in long positions within the VXX nor can I say it helps in finding a bottom in volatility.
Ultimately, neither the VIX nor the VXX are good tools to gauge volatility...
But implied volatility of the actual stock is.
Implied volatility is the anticipated volatility of a stock (or other security). Generally speaking, it increases in bearish markets and decreases in bullish markets.
Traders - particularly options buyers - want low implied volatility when they open their positions with the anticipation that it'll increase over time. In the case of an option trade, when implied volatility increases over time, it also increases the option's premium faster and by a larger amount so that the trade can be closed for a nice profit.
When you don't follow implied volatility closely, you run the risk of buying-to-open an option in which the implied volatility is already too high, making it challenging for that premium to increase. And that means it's harder for you to cash in on the trade.
So when it comes to options and maximizing your profits - I would take the media talking heads' analysis with a grain of salt and look at the implied volatility instead. The CBOE offers a free service, the "IV Index," which you can use to track the implied volatility of calls and puts as well as their historical volatility and correlation against major indices.
To your continued financial success...
Tom Gentile
The post What the Media Heads Don't Understand about the "Fear Index" appeared first on Power Profit Trades.
About the Author
Tom Gentile, options trading specialist for Money Map Press, is widely known as America's No. 1 Pattern Trader thanks to his nearly 30 years of experience spotting lucrative patterns in options trading. Tom has taught over 300,000 traders his option trading secrets in a variety of settings, including seminars and workshops. He's also a bestselling author of eight books and training courses.