


The average daily price volatility of stocks has fallen more than 60% since the beginning of 2013. It's the biggest straight-line drop in some 82 years.
A lot of investors are rejoicing. After all, stocks have risen an average of 17% a year when volatility is as low as it is right now, Bloomberg reports.
There is, however, a dark side to low volatility. Namely, it tends to precede powerful reversals that can wipe out investors, as was the case in 2000 and early 2008, and at other key turning points over the past 100 years.
Today, I'm going to talk a bit about what low volatility means for you in terms of upside, and also show you how to protect yourself in a downslide.
Let's start with the concept of average daily volatility itself.
What You Need to Know About Volatility
Average daily v olatility is a technical term used to measure the average price variation (in this case, stocks) over some period of time. Using the S&P 500 Volatility Index or the "VIX" as it's commonly known, market technicians compare current readings with readings from other time frames in an attempt to determine whether or not the markets are relatively calm or filled with angst.
What you really need to know boils down to this: Average daily volatility is low when the daily price action is within a relatively tight range from top to bottom, like it has been recently.
Conversely, it's high when the daily trading range widens, as is the case when the markets become uncertain.
The theory is that the markets tend to do better when volatility is low and poorly when it's high.
Investors, on the other hand, do better if they buy when volatility is high and sell (or at least harvest profits and rebalance) when volatility is low.
How can that be?
- Very few investors understand that volatility has nothing to do with market direction. That's because volatility is calculated by taking both positive and negative price movement into account. In other words, it's really a measure of price dispersion (or how widely prices vary). There is no directional bias nor input whatsoever - that's merely the result of people reading conclusions they want to see into data that appears to support their opinions.
- The other thing to bear in mind is that periods of low average volatility tend to precede sharp increases in average daily volatility. Volatility, in that sense, is like a heart attack that appears out of nowhere. When it hits, there's very little you can do. Prevention ahead of time is key.
You can see this quite clearly in the following charts. They cover four of the most significant market turning points in the past 12 years: 2000, 2003, 2007 and 2009.
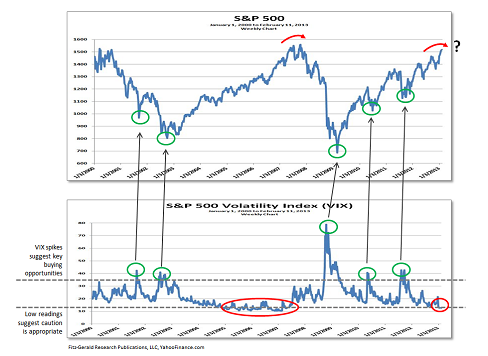
For example, notice the protracted period of low volatility from early 2005 to late 2007. Investors blindly piled in as the markets rose ever higher.
If you remember, the headlines of the time were filled with optimistic news and millions of investors thought the housing bubble (which had replaced the dot-bomb bubble of a few years earlier) was some sort of panacea. Wall Street, with very few exceptions, was only too happy to let the good times roll.
Yet, at the same time a small group of savvy investors were pulling in their horns, harvesting their gains and building up protective positions.
They knew then what I am telling you now...that periods of abnormally low volatility are a warning bell.
I remember one presentation I gave in Mexico in November of 2007 particularly well. When I whipped out a very similar chart, the audience visibly recoiled. They couldn't fathom that the markets could and would shift as radically as I suggested based on my analysis of the changing volatility situation at the time. In fact, my publisher, Mike Ward, was convinced he had hired the wrong guy as Chief Investment Strategist.
A few months later, however, after I had helped tens of thousands of subscribers sidestep and even profit from one of the most vicious market declines in recent history, he wanted to know if the reverse was true.
"Could volatility analysis help subscribers spot the beginning of a rebound?" Mike asked.
"Absolutely," I told him. I've circled those points in green above. You can see as easily as I do that volatility spikes often occur ahead of major market bottoms. Fear sets in and millions of investors make a mad rush for the exits all at the same time. That's why.
Sometimes this happens days ahead of a major bottom. Other times it's a week or even a month or two before the actual turning point - there's no way to know exactly.
But that's really moot. When you are using volatility analysis properly, the goal is not to time the markets but to identify periods of relative stability and instability so you can manage your money more effectively and more profitably.
What to Do Now...
And that brings me to what investors should be doing now that volatility has dropped to levels consistent with the bull run from early 2005 to early 2008.
First, there is no way of knowing how long the bull market will run. So you've got to prepare for the possibility that we'll get another 3 years of bullish behavior like we did from 2005 to 2008.
That's certainly what the Fed wants and why central bankers around the world continue to flood the markets with cheap capital.
The best choices, under the circumstances, are "glocal" stocks with diversified international cash flow, real products and services the world needs as opposed to merely wants. Companies like ABB (NYSE: ABB), CNH Global (NYSE: CNH), and McDonalds (NYSE: MCD) are all great examples because they bring an element of stability to any portfolio.
Glocals typically pay tremendous dividends, too, which never go out of style.
Glocals are great places to hang out if the rally continues and super places to be if things turn defensive. That's because history shows the markets treat them far better than their non-global, non-dividend paying brethren when the stuff hits the proverbial fan.
Second, many investors are sitting on significant gains at the moment (assuming they've caught the rally off of the March 2009 lows, as many Money Morning and Money Map Press subscribers have.) History shows that now's the time to begin harvesting those while also thinking about rebalancing your portfolio, a topic I cover in my new mini-book, The Money Map Method .
Doing so forces you to harvest your winners and continually reinvest your gains in undervalued choices over time. This not only helps keep portfolio management costs down, but ensures you are in the markets as effectively as possible with as much upside as you can handle.
If you're not sure what to sell, nor when, try trailing stops. By ratcheting these up as prices rise, you are not only potentially locking in corresponding gains, but you are automatically ensuring a sell discipline that will help keep small losses from turning into catastrophic ones if the markets do roll over.
If you're a more sophisticated investor, put options can help you accomplish the same thing without having to sell and are, therefore, a great alternative if you absolutely positively can't bring yourself to unload a favorite investment.
And, third, begin buying specialized inverse funds like the Rydex Inverse S&P 500 Strategy Inv (RYURX). It goes up when the markets go down.
Studies show that having 3-5% of overall investable assets in truly non-correlated choices can lead to significant profits when many other investors will be crying in their beer.
My point is, no investor has to suffer the ravages of a bear market if they are properly prepared and understand what volatility is really trying to tell them.
[Editor's Note: Keith Fitz-Gerald's track record is jaw-dropping. At the moment, 78% of the recommendations in his Money Map model portfolio are in the win column.
And that's not to mention the 44 other double- or triple-digit wins Keith's rung up for his readers across the board since the Great Recession began in 2008.
His secret is the proprietary 50/40/10 Strategy and his amazing Money Map Method.
If you would like to learn more about Money Map Press and receive a free copy of Keith's latest book entitled: The Money Map Method: Lifelong Wealth in a World of Runaway Debt, click here.]
>>Now read As Insiders Head For the Exits, Do They Know Something "We" Don't Know?
[epom]
About the Author
Keith is a seasoned market analyst and professional trader with more than 37 years of global experience. He is one of very few experts to correctly see both the dot.bomb crisis and the ongoing financial crisis coming ahead of time - and one of even fewer to help millions of investors around the world successfully navigate them both. Forbes hailed him as a "Market Visionary." He is a regular on FOX Business News and Yahoo! Finance, and his observations have been featured in Bloomberg, The Wall Street Journal, WIRED, and MarketWatch. Keith previously led The Money Map Report, Money Map's flagship newsletter, as Chief Investment Strategist, from 20007 to 2020. Keith holds a BS in management and finance from Skidmore College and an MS in international finance (with a focus on Japanese business science) from Chaminade University. He regularly travels the world in search of investment opportunities others don't yet see or understand.