


I recall the presentation vividly.
It was November 2007 and I was standing in front of a packed room at a really swank resort along the Mexican Riviera. Money Map Press was in its infancy, and I was making my first public appearance as its chief investment strategist.
The markets were rocketing higher, the money was easy, and investors were greedy.
Until I got on stage.
I dropped a financial bomb of epic proportions by telling my audience two things: 1) the rally they were counting on was about to come screeching to a halt; and, 2) they'd best shift their attention to harvesting profits.
You could have heard a pin drop.
I made my case as simply as I knew how... a "compressed range since 2005 shows [the] market ready to snap just like [it did] in early 2000."
Then, I threw the following chart up on the projector, knowing full well that a picture is worth a thousand words... or at least a few million dollars in the hands of savvy folks.
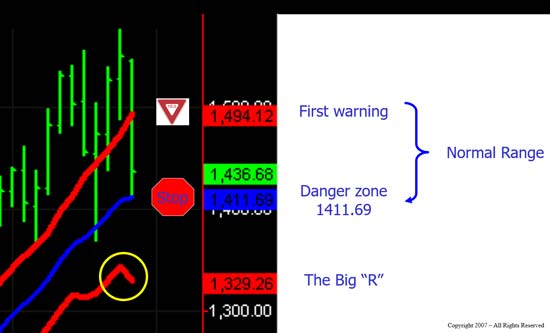
Pay particular attention to the yellow circle.
My analysis suggested that the S&P 500 would fall to 1,329.26 by March 1, 2008, before making a brief stand and collapsing further.
It was tough stuff made doubly so because conventional Wall Street analysts would have sugarcoated the news... that is, if they had even seen it coming in the first place. Most, as you know, did not... which is why the financial carnage that followed was so very painful for many.
In my capacity as chief investment strategist, though, I had no choice but to tell investors three things, even if they were unexpected and uncomfortable: 1) exactly what my analysis showed, 2) why it was happening, and most importantly, 3) how to profit from a market collapse that I believed was going to catch millions of unsuspecting investors by surprise.
You see, my success is derived directly from your success, not Wall Street's special interests or corporate sponsors. That's why I take the trust you place in me and in my team very, very seriously and why, today, we are the No. 1 independent financial research firm in the world.
But, getting back to the point, you know how the story ends just as well as I do.
The S&P 500 actually closed at 1330.45 on Feb. 29, 2008... before falling off a cliff as the Global Financial Crisis hit. Ultimately, the S&P 500 would tumble 56.4% from the peak it set on Oct. 9, 2007, and shave a staggering $15 trillion from global markets.
Investors who went to the sidelines - as I advocated - made "bank" by harvesting profits. More aggressive readers did even better by purchasing inverse funds like the Rydex Inverse S&P 500 Strategy - Investor Class (RYURX) and put options.
Critically, they also began redeploying those gains into rock-solid companies almost immediately. Choices I recommended like SPDR Gold Shares (NYSE Arca: GLD), Monsanto Co. (NYSE: MON), and ABB Ltd. (NYSE: ABB) would go on to triple-digit returns before subscribers were done with 'em.
Those who didn't and who struggled to "buy the dips" may as well have been rearranging the deck chairs on the Titanic because their portfolios still got decimated.
You Must Act Now: America is headed for an economic disaster bigger than anything since the Great Depression. If you lost out when the markets crashed in 2008, then you are going to want to see this special presentation...
Could I have been wrong?
Absolutely.
I am NOT telling you this today to make myself look smart, nor to create the opinion that I am the greatest financial analyst since sliced bread. I am not - I put my shoes on one foot at a time, every day, just like you do.
The advantage I have is one drawn from 35 years of experience in global markets as a consultant, analyst, and trader and tens of thousands of hours studying the worldwide financial markets.
I could care less about being "right" (which is how most amateurs approach the markets). What I do care deeply about, though, is helping you find the world's best investment opportunities and showing you how to profit handsomely in all kinds of market conditions (which is how legendary investors like Warren Buffett and Jim Rogers do things).
I'm telling you all this for a reason.
I recently updated that same chart I showed my audience more than a decade ago and, once again, I see a potentially very nasty turn of events ahead.
The compression that was present back in 2007 has reared its ugly head again. Technically speaking, prices have fallen off since January and are now trading just above a critical line of "last resort," which I've highlighted in yellow.
At the same time, emotions are running high, which confirms a change in sentiment I noted during an appearance on "Varney & Co." this past Monday morning, where I made the same point in response to anchor Stuart Varney's question about the possibility of a correction.
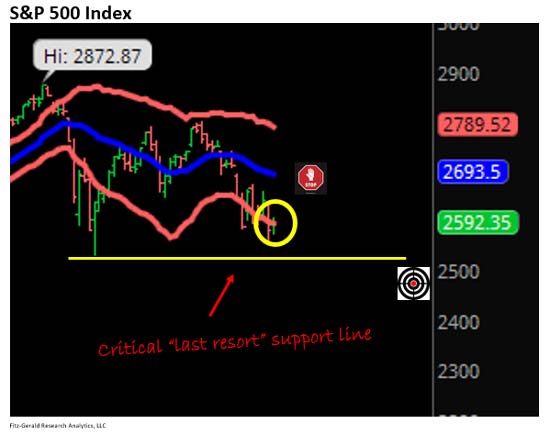
The next stop is 2,476.79 in May if the markets cannot hold at the lows set Feb. 9, 2018. Or, sooner.
From there, chances are good it'll be another white-knuckle ride... a "Great Reckoning," if you will.
The vast majority of folks don't see this coming, and those few who do are not preparing properly... nor profitably.
If you're like me, you've felt a sense of market turmoil ahead. This chart should be all the proof you need to take action. The last time it looked like this it was just months before the epic 2008 crash that pushed our financial system to the brink.
Ask yourself, right now, in light of what I've just laid out: Are you where you want to be financially?
If the answer is yes, that's great.
If the answer is no, then you are NOT alone, and you need to click here.
So, Now What?
As always, a little perspective is in order.
Millions of investors fear information like that which I've just shared with you because they have no idea what to make of it nor how to handle the fact that what I'm telling you is just around the proverbial bend.
Thankfully, you're not in that crowd.
As a member of the Total Wealth family, you've got a number of significant advantages - not the least of which is a very different perspective from traditional investors who risk having their 401(k)s turned into 201(k)s for the third time in less than 20 years.
As we have discussed many times, the right perspective is also the most profitable perspective. Here's what that means...
[mmpazkzone name="in-story" network="9794" site="307044" id="137008" type="4"]
Right now, it means you're still after profits, but you want to take a moment to don the psychological armor needed to protect your money against the emotional inputs that will destroy other investors as conditions deteriorate in the face of a trade war, increasingly tense international relations, and disjointed politics on both sides of the aisle.
This makes sense when you think about.
When the markets are running higher, our emphasis is on loss prevention because we want to make money with every stock we own, every day we own it. When they're running lower or losing gas, as is the case now, your primary focus becomes harvesting profits - a subtle distinction lost on most investors.
To be clear, I am not suggesting you time the markets - doing so never works out the way people think, despite their best intentions.
A rules-based approach, like the one I advocate, is always more effective, which is why it's at the heart of every investing service I offer and a crucial part of the Total Wealth investing process.
I want you to start taking profits as fast as the markets want to hand them to you by doing three things. Chances are good that you will have a bunch - of profits, that is - if you've been following along for any length of time:
- Use Total Wealth tactics like trailing stops and profit targets to calmly and systematically harvest profits like clockwork without the emotional interference that cripples most investors who sell in a panic when the you know what hits the fan. This guarantees that you are constantly raising cash you can put to work later, even as other unsuspecting investors burn theirs. Again, this is how legends like Warren Buffett and Jim Rogers approach markets and how Sir John Templeton, one of the greatest market masters in history, did.
- Buy a short-term 1:1 inverse fund like the Rydex Inverse S&P 500 Strategy - Investor Class (RYURX) or an ETF like the ProShares Short S&P500 (NYSE Arca: SH). Both will rise as the S&P 500 falls, which means you can profit from the sting that will devastate other investors. Buying put options is also a great way to go if you're options-savvy, but what I'm talking about today is protecting your core investments, not speculating.
- Put new money to work in ONLY those holdings like the Triple Compounders we've talked about recently, or the world's best Global Growth and Income plays like NextEra Energy Inc. (NYSE: NEE), Baidu Inc. (Nasdaq: BIDU), and Visa Inc. (NYSE: V), which still have solid business cases and even more solid profits ahead.
In closing, I know a column like this one can be scary.
Believe me, I certainly think twice every time I have to write one, which thankfully isn't very often.
But, don't let that stop you from investing.
Growth may slow but it will not stop.
The things we talk about all the time - Unstoppable Trends, "must-have" companies, and the need for consistent, unemotional risk management - will help you weather the storm I see brewing on the horizon and come out stronger on the other side.
And I'll be with you every step of the way.
Bloomberg Reports: "Trouble Is Brewing."
According to Bloomberg's latest report, America could be heading for an economic disaster that would rival the Great Recession.
Billionaire Ray Dalio's hedge fund - Bridgewater Associates - has made a $22 billion bet against the market.
And Citibank calls our present situation "eerily reminiscent of the mortgage crisis."
To see why we believe some of the richest players in the world are preparing for a market collapse, click here.
The post The Last Time I Saw This Chart It Was 2007 appeared first on Total Wealth.
About the Author
Keith is a seasoned market analyst and professional trader with more than 37 years of global experience. He is one of very few experts to correctly see both the dot.bomb crisis and the ongoing financial crisis coming ahead of time - and one of even fewer to help millions of investors around the world successfully navigate them both. Forbes hailed him as a "Market Visionary." He is a regular on FOX Business News and Yahoo! Finance, and his observations have been featured in Bloomberg, The Wall Street Journal, WIRED, and MarketWatch. Keith previously led The Money Map Report, Money Map's flagship newsletter, as Chief Investment Strategist, from 20007 to 2020. Keith holds a BS in management and finance from Skidmore College and an MS in international finance (with a focus on Japanese business science) from Chaminade University. He regularly travels the world in search of investment opportunities others don't yet see or understand.