A couple weeks ago, we talked about how you can use the U.S. economy to pinpoint your next perfect trade.
And one of the most accurate ways to monitor the overall state of the economy is the Conference Board Consumer Confidence Index, which is designed to measure the degree of optimism consumers have about the economy.
Yesterday, the Conference Board released surprising results... showing that consumer confidence improved in March, reaching a much higher level than what economists predicted last month.
Even better...
Stock prices have rebounded since the lows we saw in mid-February, reflecting the higher confidence levels in the markets.
Today, I'm going to show you how you can use that investor confidence to set up trades that'll double your money.
And by the time you finish reading, you'll have the tools you need to tell which direction a stock is going and if the price is considered high or low.
Let's get started.
Everything You Need to Know About Bollinger Bands... in a Nutshell
Today we're going to talk about a technical indicator that measures whether or not stock prices are relatively high or low. But we're not going to be looking at the numerical value of the stock.
First, let's get a little context...
As surprising as this may sound, volatility used to be deemed, overall, static. But that changed when a man named John Bollinger came along.
Bollinger was born in Montpelier, Vermont, on May 27, 1950, and is a financial analyst and author. And his observation was that volatility is, in fact, dynamic.
His largest claim to fame happened in the 1980's when he developed a game-changing technical indicator that bears his namesake - called Bollinger Bands. Bollinger Bands are a technical analysis tool used to measure the relative highs and lows of a stock.
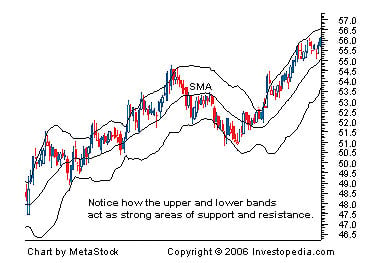
Bollinger Bands are also called "volatility bands" and consist of three bands: upper, middle, and lower. The middle band is a simple moving average (SMA).
A moving average is a simple technical analysis tool that gives you the average price data of a stock or exchange-traded fund (ETF) over a specific time period (you can tailor it to whatever time frame you like, making it a good tool for both short-term and long-term trades).
The upper band is above the SMA, and the lower band is below the SMA. The SMA typically used as a default by most charting programs is the 20-day SMA.
Bollinger Bands also apply standard deviation. The term "standard deviation" is a measure of volatility you can use to see how Bollinger Bands adjust according to market conditions or market volatility.
One of its basic uses is to measure or ascertain when stocks are in periods of contraction (low volatility) or expansion (increasing or higher volatility).
This is how Bollinger Bands look on the screen...

These "bands" are two lines plotted on a stock chart. By definition, when the stock is trading at the upper band, the price is deemed high. When the stock is trading around the lower band, the price is deemed low on a relative basis.
The Three Bollinger Band Patterns to Look For
When using Bollinger Bands, your goal is to find stocks in a periods of low volatility (where the stock is trading somewhat flat), but preferably, you'll want to look for stocks that are trading a bit flat in an overall upward or downward trend. The reason being... when the stock starts to break out of its flat trading range, it does it to the degree that the bands start to expand or widen - putting you in a strong position to move in on the stock.
Now let's talk about the three patterns to look out for when using Bollinger Bands...
[mmpazkzone name="in-story" network="9794" site="307044" id="137008" type="4"]
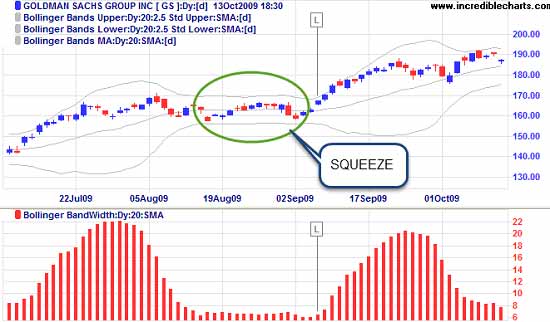
Bollinger Band Pattern No. 1: The Squeeze
When the stock is in a flat period of trading, you will see that the outer Bollinger Bands are pinching (or have pinched). They then go into a period of time where the formation moves horizontally in nature to the stock price. I circled where the squeeze occurs below.

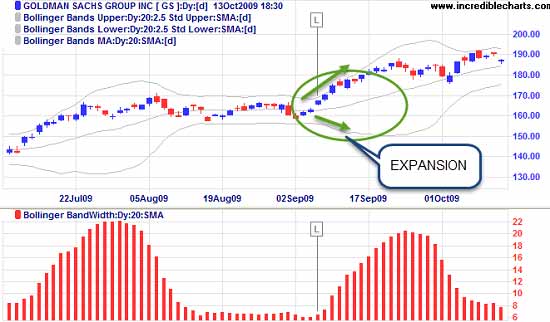
Bollinger Band Pattern No. 2. Expansion
When the stock starts to break out, you will see the outer bands start expanding in opposite directions. You can see where the expansion occurs in the circled area of the image below.

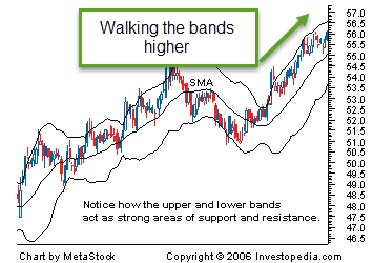
Bollinger Band Pattern No. 3. "Walking the Bands"

One beautiful thing that can happen is when the stock starts "walking the bands." That's when the stock trades higher or lower on the actual Bollinger Band itself.
As the bands continue to expand, and the stock price rides along the upper or lower band, it signals that the trend is intact and has more validity than when the stock starts trading away from the upper or lower bands. You can see this in the image above.
Now later on, we're going to talk about two key technical patterns you'll want to use in conjunction with Bollinger Bands - and those duos can provide the type of trade setups to easily double your money... or better.
But until then, know that the bands are there to indicate on a relative basis if the stock price is high or low. Next, you can visually understand if the stock is in a period of low volatility (the squeeze) or if the stock is expanding with a pending directional move soon to come (expansion).
Follow Money Morning on Facebook and Twitter.
Look for These Candlestick Patterns to Make More Money: Knowing how to read candlestick charts is critical to ensuring you're on the right side of the action. Learn to spot these particular candlestick patterns and you'll be able to outwit, out-trade, and outperform the competition starting today...
About the Author
Tom Gentile, options trading specialist for Money Map Press, is widely known as America's No. 1 Pattern Trader thanks to his nearly 30 years of experience spotting lucrative patterns in options trading. Tom has taught over 300,000 traders his option trading secrets in a variety of settings, including seminars and workshops. He's also a bestselling author of eight books and training courses.


