

GameStop & Roaring Kitty’s Nonsense Will Hurt Investor Confidence
I’ve seen some really weird things trigger a market correction, we may have just seen the worst of them on Friday.
More than 650,000 people tuned in to Roaring Kitty’s YouTube Live session on Friday, just after noon. From the looks of the stock ahead of the session, many thought that Keith Gill (A.K.A. Roaring Kitty) was in a suit with his pitch deck ready to present his turnaround plan for GameStop.
Maybe he would announce a partner in his venture or perhaps some equity funding from an outside source to help get the company moving in the right direction.
Nah, he got on the screen, proclaimed that it was five o’clock somewhere and cracked open a beer.
Gill did talk about his faith in Ryan Cohen, all watching 100’s of millions of value get scorched from his E*TRADE account.
Viewers dropped from his session just as quickly as the stock fell another 10%.
Friday was the crescendo moment for GameStop.
It was the moment that investors got to see behind the curtain, again. The last time that we saw behind the curtain GameStop stock dropped from $85 to $10.
Remember the saying “Fool me once… shame on you, fool me twice… shame on me”?
The latest round of foolishness is going to cause a lot of investors to lose faith in the markets, at a very bad time to lose faith.
Last week, I wrote about the eroding technical situation in stocks, the fact that we’re heading into the worst month of the year for stocks, bad market breadth and a few signs that the bond market is preparing for a rough summer.
For just a few moments, the market chooses to watch the sideshow of “Roaring Kitty” losing hundreds of millions while drinking a beer.
From a contrarian and common-sense perspective, this market just saw what may have been the trigger for a rougher than normal June and July for stocks.
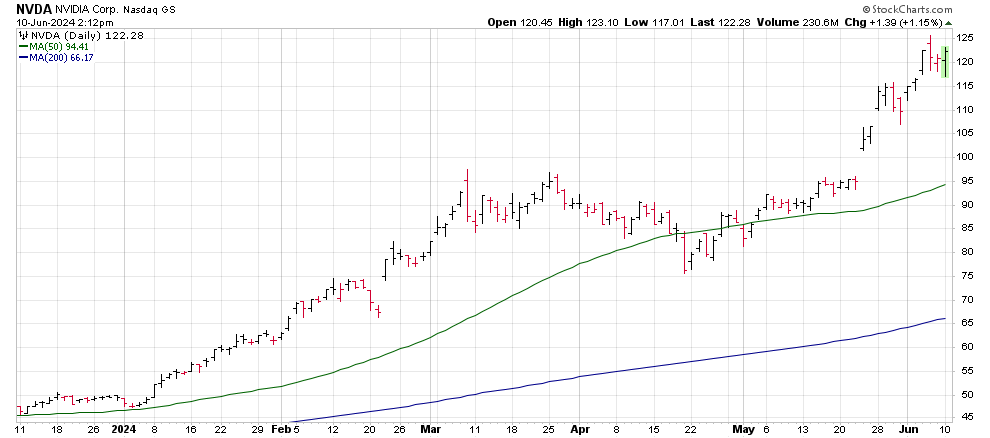
Here’s What Happened to NVIDIA’s Price
It happens every time.
I got a text message this morning from one of my golf buddies. It read “What happened to nvda stk px??”
Shares of NVIDIA are trading at $120 this morning after the company executed its 10-for-1 stock split after Friday’s close. Shares dropped from a price hovering just above $1,200 to $120 as a result.
As I always remind people, these splits do not change the value of the company or your investment in the company. You now have ten times the shares that you owned before the split at a price that is one tenth. It all washes out.
What does a split do? In the case of a split like this, it brings the price back to a “normal” price range. Let’s face it, most investors look at a stock with a price tag of $1,000 and find it hard to purchase.
Large price stocks are harder to diversify a portfolio with, they feel more volatile – even though they generally aren’t – and they’re just intimidating.
A stock split is nothing more than a marketing move. Smaller box of something – in this case your ownership of the company – for a smaller price. Like the difference between buying 64 rolls of toilet paper at Costco and 4 rolls at Kroger.
Is There Any Danger with a Stock Split?
YES!
Just like any other event for a stock, a stock split often creates a “buy the rumor” rally.
Investors and traders will buy shares of a stock ahead of its split in anticipation that the new lower price will attract new buyers, pushing the stock price even higher. That means that we’ll see a short-term rally in the stock being split just ahead of its split.
Just like any other “buy the rumor” rally, you also see a “sell the news” reaction. It’s just hard to get one without the other.
Looking back through 2000, there have been four previous splits of NVIDIA stock. In general, two of these splits have resulted in notably lower prices 30 days following the stock split.

The most recent two splits resulted in prices of NVIDIA rallying an average of 17% 30 days after the split.
Remember that these returns represent four single events, meaning that they cannot be used as a reliable forecast of where NVIDIA’s price is headed for the next month.
Should You Buy NVIDIA Now that it has Split?
In my opinion, no.
Consider the following…
- The split comes as we head into a weak seasonal month
- A monetary policy meeting this week during which we are likely to hear Jerome Powell once again tell us that the Fed is going to remain slow and steady by not lowering rates. The market won’t like that.
- A period in which the small cap Russell 2000 Index just broke a key trendline
- NVIDIA shares needed a healthy correction before the split. The split doesn’t change that.
The market is going to have quite a bit of pressure on its shoulders this week. My guess is that profit taking of NVIDIA’s GUHE gains will be triggered under that pressure. That puts NVIDIA in a situation that is more likely to result in losses over the next month, not further gains.
I am looking to increase my position in NVIDIA at $105, which would represent a healthy pullback for the stock.
Let’s hit the Seasonality Once More
Because I mentioned it a moment ago, I want to take just a minute to walk you through the seasonality and its implications.
First, why do we follow seasonality?
The answer is simple, yet complex. It all comes down to psychology and earnings (to some degree).
First, the psychology. Investors like things to be simple. Sayings are easy to follow. I’m talking about something as easy as “Sell in May…”, “Buy the October Dip”, “Buy January’s Pullback.” You’ve probably heard them all and for the most part, the have some effectiveness because investors “believe” they work so they follow them.
“Sell in May” is somewhat effective, but only because of a few bad months within that stretch. June is one of them, August and September are the others.
Over the last 20 years, the month of June has racked up average losses of 0.4%. That’s low enough to count it as the second wort month of the year. September is the worst, more than doubling June’s bad performance.

I mentioned earnings as a driver in the seasonal trends. Take note of the performance of each of the months that earnings season begins and their performance. Simply investing in these months would net a positive return with lower volatility.
Here’s the bottom line you need to know.
June is a bad month for stocks, period, end of sentence.
There’s a vacuum of headline activity while volume in the market drops because of the beginning of the vacation season. We’ll see activity pick up in July again when earnings start to fire up, and then things will drop off in August all over again.
Average buy and hold investors, just sit where you are. Taking a month of lower prices shouldn’t be a big deal. No need to hedge, etc…
Active investors… this is the time to act.
Start eyeing positions in your portfolio with large returns and trim them. At the same time, start setting lower prices that you want to buy those positions back at right now, as you trip profits. Think of it as your own “Stock Buyback” program.
Traders… This market is balancing between a short-term bull and bear market. The Russell 2000 is pressing against the critical $200 level and two closes below that mark will draw large cap stocks into the fight.

We last saw this technical situation in April. The Russell 2000 dropped 5% along with the S&P 500 and Nasdaq 100. We had the strong seasonality effect helping stocks at that time, something that is not in place this time around.
Regional banks and other “canary in the coalmine” stocks have already started trending lower. This means that the market’s lofty valuations are being supported by fewer and fewer stocks. That’s a situation that almost always results in a sharp pullback from highs.
Here’s How I’m Positioning for a Rough May…
The most simple and effective hedge from my perspective is the use of 3-6 month put options on the Russell 2000 Index. These offer enough time premium that you aren’t fighting the calendar and benefits from the early intermediate-term bearish trend that is forming in the IWM.
A simpler hedge or short can be found by using the inverse IWM ETF “SRTY”. This inverse ETF produces positive returns of 3% for every one percent drop in the Russell 2000 Index.
As always, determine your target and stop prices before opening a new hedge.