


Shares of Apple Inc. (Nasdaq: AAPL) are taking a breather, leaving many investors wondering if they've made an iBoo-Boo.
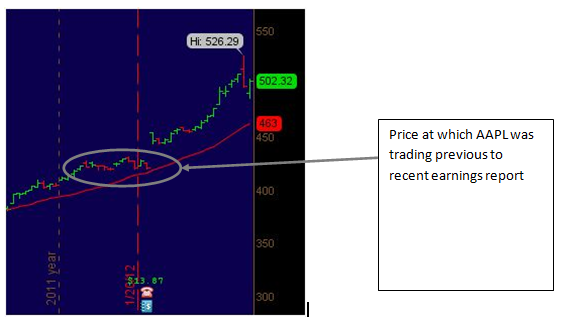
The hottest stock on the Nasdaq has fallen more than 4.6% as I write this since hitting a new intraday high of $526.29 on February 15, 2012.
Does that mean it's time to sell?
Perhaps, but first you should ask yourself why.
Apple Inc Stock Price History
|
If you're a long-term investor, there's a lot to look forward to. Apple is much more than a brand; it's a lifestyle. People tattoo the company's iconic brand on their rear ends for crying out loud.
Always the innovator, Apple has barely scratched the surface with regard to new devices and has hardly tapped into ways to use them.
People line up thousands-deep to buy newer versions of the company's most basic products every year -whether they need them or not.
That is something no other tech company has figured out how to do.
Plus Apple's market share is growing overseas, with a particular emphasis on the Asian Rim.
In China alone, for instance, there's the potential for another 30-50 million iPhone sales in the next 12 months that could add another $4-6 in EPS to Apple's bottom line.
I remain convinced that Apple could be the world's first trillion-dollar company and I'm not alone in my thinking. Since I first voiced that highly controversial opinion a few years ago, many other firms and analysts have joined me.
How to Play the Short-Term Apple Top
But in the short term, Apple's chart now looks like a classic blow-off top- and technically speaking it is.
Last Wednesday, we saw the stock close near the lows of the day after making a quick run up and a high volume, hi-speed failure midday.
The chart tells the story. Take a look
")
Like all charts, though, this is a matter of perspective.
Stocks that have run a long way in a short time often require some "digestion," or to use a market term, "give back." And Apple is no exception, particularly when you consider the stock has moved up 44.76% in only three months from $363.57 to $526.29.
If we contrast the prior chart with a longer-term view, we see Apple is simply accelerating ahead of a major trendline (seen below in red).
Not only does this speak to a pull back for the company - which traders have simply pushed ahead of itself on nothing more than euphoria - but it also highlights the next logical value buying point at $463.00 for aggressive traders, or roughly 6.96% lower than Wednesday's blow-off-induced close of $497.67.
")
Of course, if you are more conservative you could consider buying Apple at roughly $420 - $430 which is where Apple was trading prior to the most recent earnings announcement that fueled this latest run.
Positioning Your Portfolio in Apple Stock
As for when we might get there, that's a different question.
Blow-offs like this one typically set intermediate-term highs that last, on average 90-145 days. Not always, but enough of the time that even if the stock wants to run higher in the days ahead, a period of lower price digestion is likely ahead.
So there's a little time to play with.
- Aggressive traders wanting to play the downside could consider put options or shorting the stock until it gets down to the $460ish ranges where there is likely to be aggressive buying support.
- More conservative investors who want to add to existing Apple positions or establish new ones may find waiting until the price drops to the $420 area makes more sense.
Either way, be prepared for some volatility. Stocks like Apple that become media darlings tend to take on a life of their own before they again settle down and head higher.
Related Articles and News:
- Money Morning:
Buy, Sell or Hold: 100 Billion Reasons To Buy Apple Stock - Money Morning:
How iTV and iPad 3 Will Push Apple Inc. (Nasdaq: AAPL) Over $600 - Money Morning:
Fuzzy Math, Greater Fools and the Facebook IPO - Money Morning:
The Markets or the Mattress: I Know Where My Money is Going
About the Author
Keith is a seasoned market analyst and professional trader with more than 37 years of global experience. He is one of very few experts to correctly see both the dot.bomb crisis and the ongoing financial crisis coming ahead of time - and one of even fewer to help millions of investors around the world successfully navigate them both. Forbes hailed him as a "Market Visionary." He is a regular on FOX Business News and Yahoo! Finance, and his observations have been featured in Bloomberg, The Wall Street Journal, WIRED, and MarketWatch. Keith previously led The Money Map Report, Money Map's flagship newsletter, as Chief Investment Strategist, from 20007 to 2020. Keith holds a BS in management and finance from Skidmore College and an MS in international finance (with a focus on Japanese business science) from Chaminade University. He regularly travels the world in search of investment opportunities others don't yet see or understand.